Visual Expert allows collecting performance data of PowerBuilder applications on multiple workstations in production.
The consolidated analysis of these traces will allow PowerBuilder developers to easily identify code that needs to be optimized to improve response times and user experience.
Visual Expert Performance Tuning Macros answer these questions:
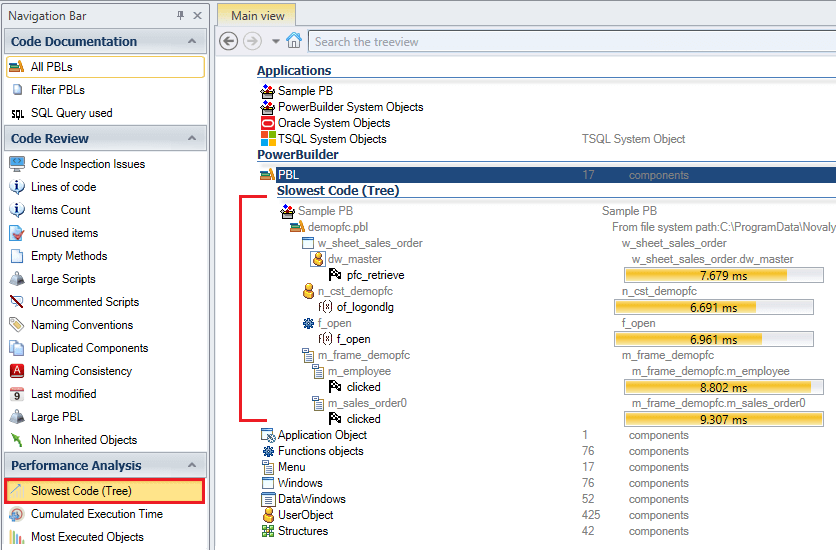
Slowest Code (Tree)
This macro displays the objects or methods taking the longest average execution time when the application is in production.
Follow this tutorial to apply it to your code.
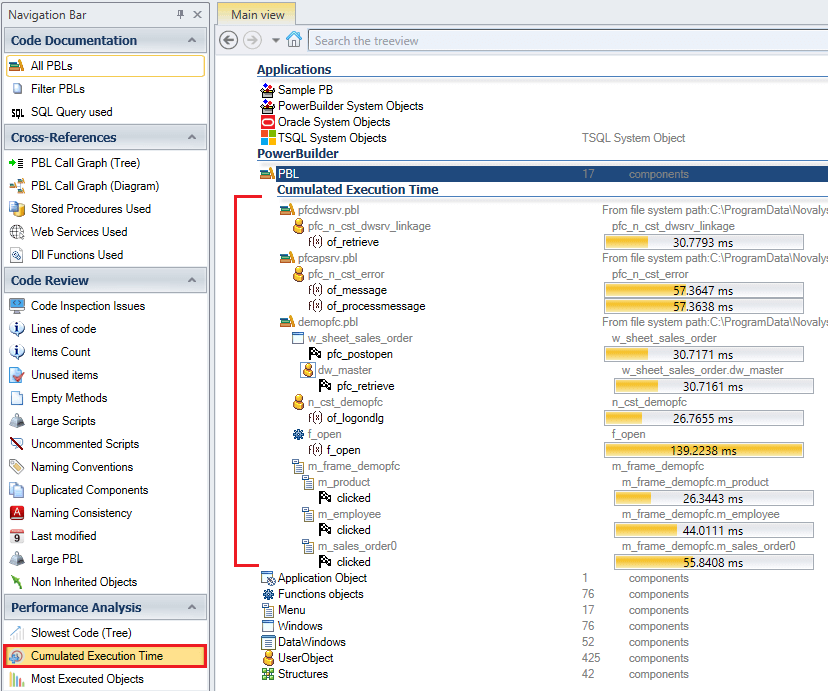
Cumulated Execution Time
Based on the principle that an object that is executed very frequently must be fully tuned to avoid hindering the user experience, this macro lists the items that consume the most time during user sessions.
Measurement formula: [Average execution time * number of executions]
Follow this tutorial to apply it to your code.
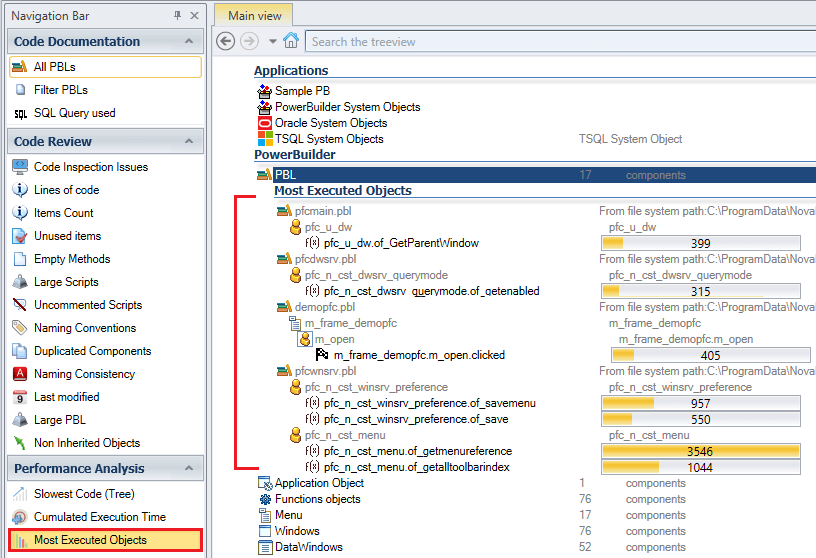
Most Frequently Executed Objects
As part of a general optimization process, this macro helps to list the PowerBuilder objects that are executed more frequently than others.
Follow this tutorial to apply it to your code.
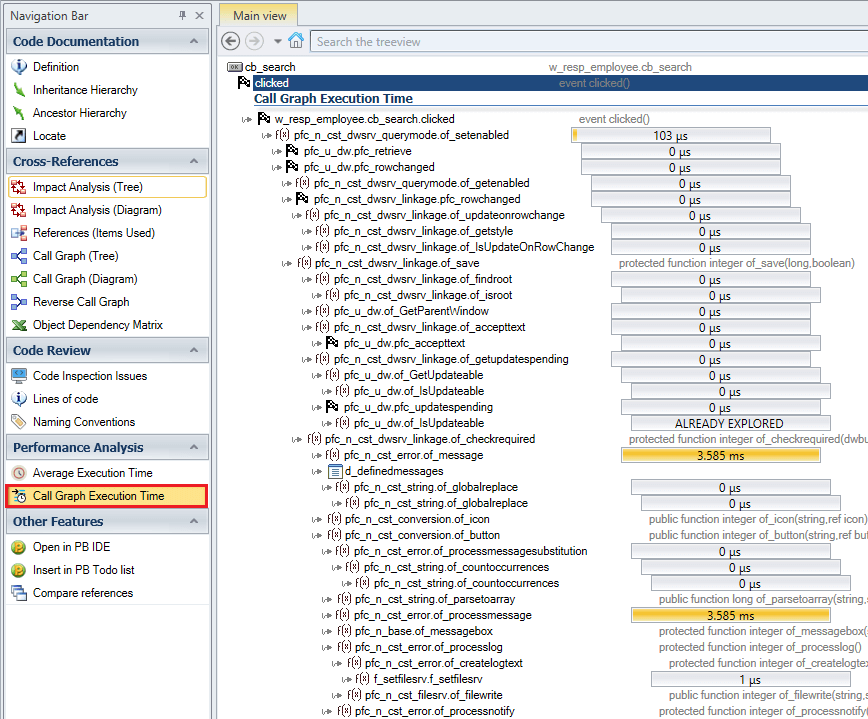
Call Graph Execution Time
This macro helps to improve slow features dependent on a long chain of calls in your PB app.
To display a visual representation of the call graph, with execution times of each node:
- Select a PB item in the treeview.
- Click on [Call Graph Execution Time] in the navigation bar.
Read this use case to learn how to improve a specific feature in the application.
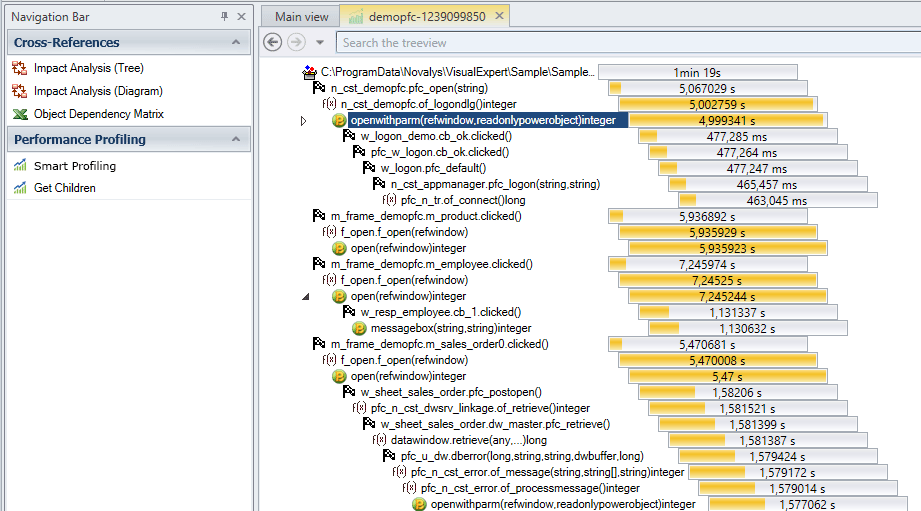
PowerBuilder Code Profiling
Beyond analyzing performance data across workstations, code profiling offers a deeper dive into specific performance issues. With Visual Expert, you can trace your PowerBuilder code to identify lines or methods causing delays. Follow this tutorial to apply it to your code.
How it Works
- Smart Profiling: Focuses on components that use the most time, highlighting them for quick optimization.
- Detailed Analysis: Shows which lines of code consume the most time, allowing targeted improvements.
Key Features
- Customizable Profiling: Adjust thresholds for what is considered slow.
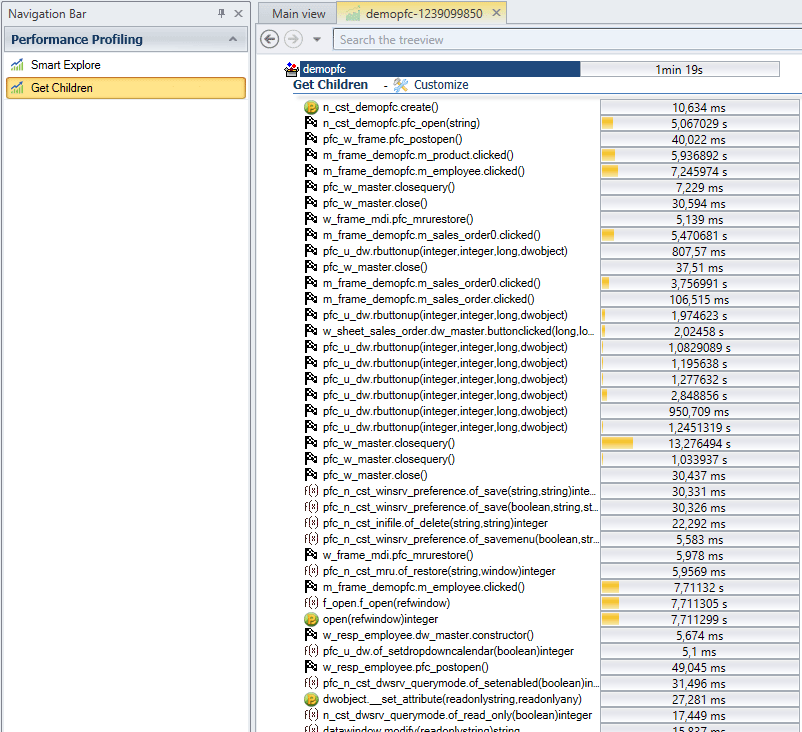
- Get Children Macro: Lists child objects with high execution times for focused optimization.