When a user reports a feature that is too slow to run, it may be difficult to find the cause if that feature depends on a long chain of function and object calls. In that case, Visual Expert provides a visual representation of the call graph, with execution times of each node, to help identify the slowest pieces of code.
Using "Call Graphs Execution Time" for Performance Analysis
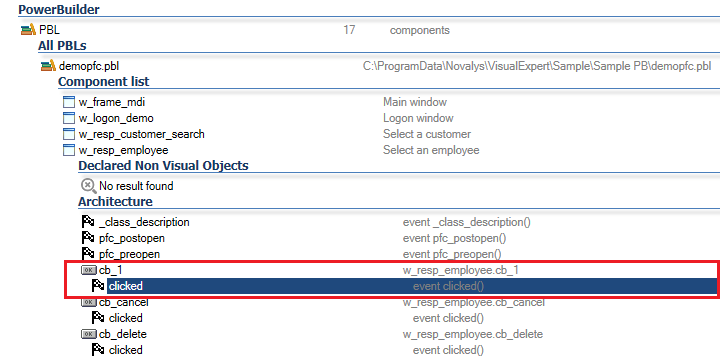
Let’s assume that there has been a user complaint about the response time for the click event of this button:
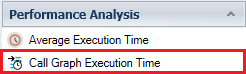
- Go to Performance Analysis in the Navigation Bar.
Click on [Call Graph Execution Time].
- Visual Expert will display the chain of calls executed after the click event of this button. And for each step of the way, the average response time.
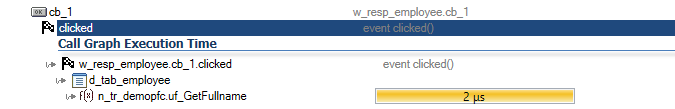
The above example is based on a very short chain of call and can be reviewed just by looking at the few pieces of code involved.
Let’s take a more complex case with the example below:
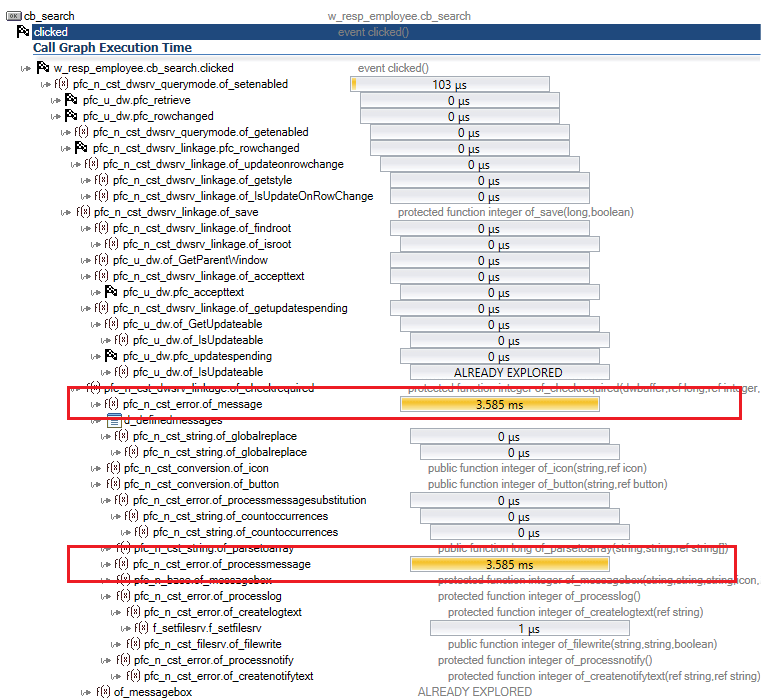
This shows PowerBuilder methods calling each other, with a chain of hundreds of different calls. It would be difficult for a developer to even draw it up, let alone find out where the time is lost.
This Visual Expert feature allows PB developers to visually identify the method with the highest response time (yellow bar), to optimize it and improve a particular application feature.
Using “Slowest SQLs” for Performance Analysis
Imagine a DBA finding a particular SQL slowing down the database. He may report it to the development team, but they would have a hard time finding where this SQL is coming from.
Visual Expert can help to identify which object / method has generated this SQL.
To do so:
- Select the related Table - for instance the [CUSTOMER] table.
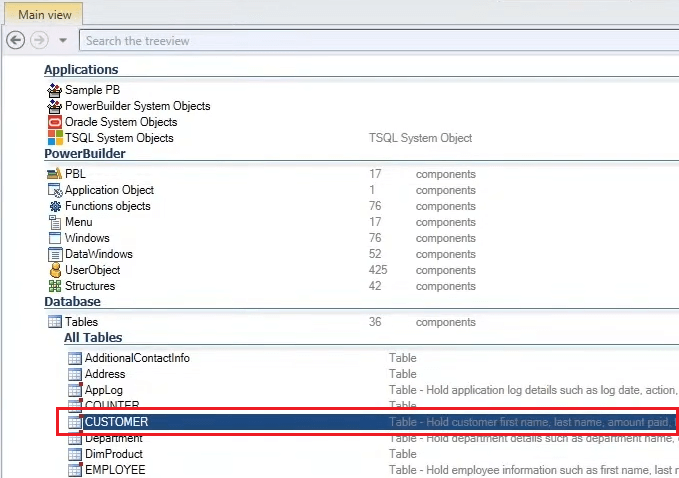
- In the Navigation Bar, go to Performance Analysis. Click on [Slowest SQLs accessing this table].
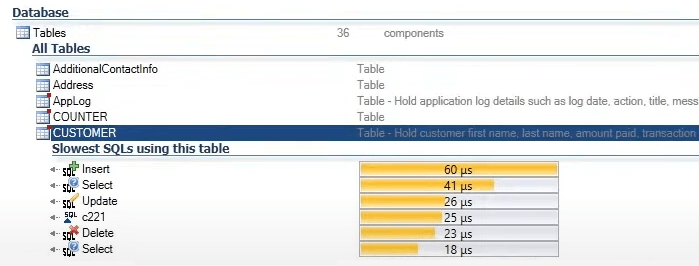
Visual Expert will display the slow SQLs sorted by Average Execution Time.
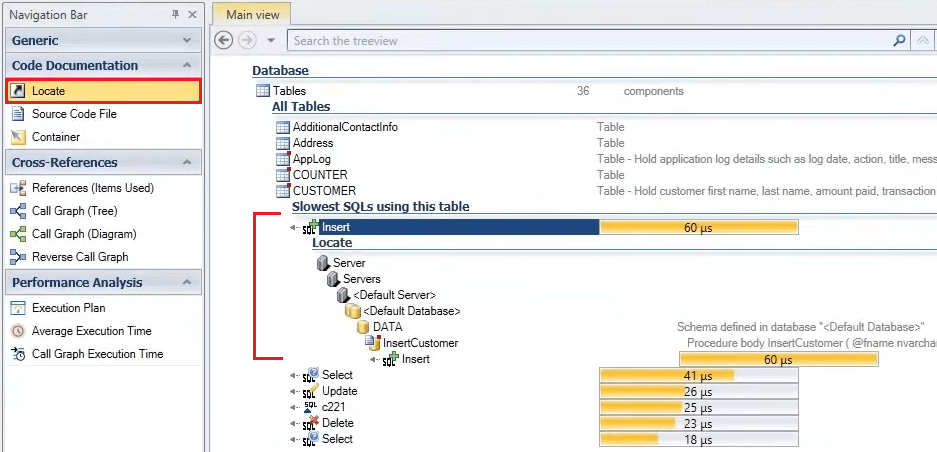
- To find out where a particular SQL is coming from: Select it and click on Code Documentation > Locate.
VE will show the containers of this item in a hierarchy. In the example below, a slow insert statement is coming from the Stored Procedure “InsertCustomer”, contained in the Schema called “DATA”.
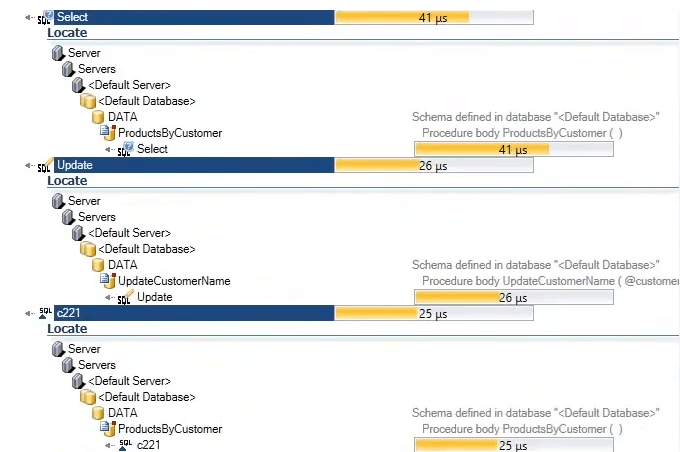
- Note: Visual Expert can show the container hierarchy for multiple SQLs at once.
Performance Tuning for PowerBuilder | Watch Demo
A video tutorial from Elevate 2022 conference demonstrating the above use cases: