Explore, Analyze & Document your Code
Data Models Diagrams
WHY USE DATA MODELS DIAGRAMS?
They provide a graphical representation of database entities and their relationships.
These diagrams are typically used for:
- Database design: organize, analyze or review relational databases
- Database troubleshooting: analyze existing data structures to find and resolve problems in logic or deployment.
HOW TO GENERATE A DATA MODELS DIAGRAM?
1. Check the minimum requirements
- If your VE project reads code from a database, it should include tables and views.
- If your VE project reads code from files, it should include DDL statements to create tables, views, triggers, foreign keys, etc.
2. Generate the Data Model
- In the treeview, double-click on the table icon to open the list the tables.
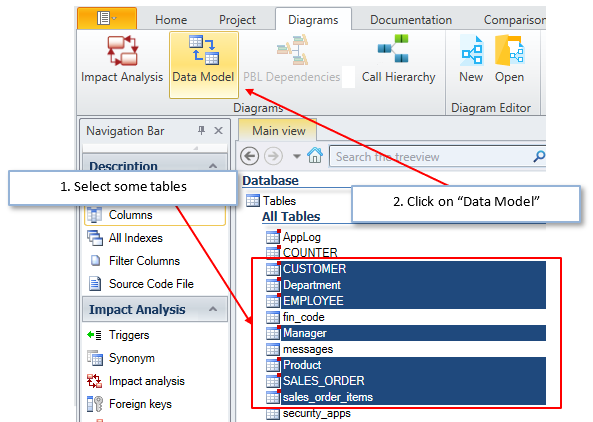
- Select some tables:
- Use the [Ctrl key] to select several tables
- If needed, use the search field above the treeview to find them.
- Go to [Diagrams] in the ribbon menu. Click on "Data Model"
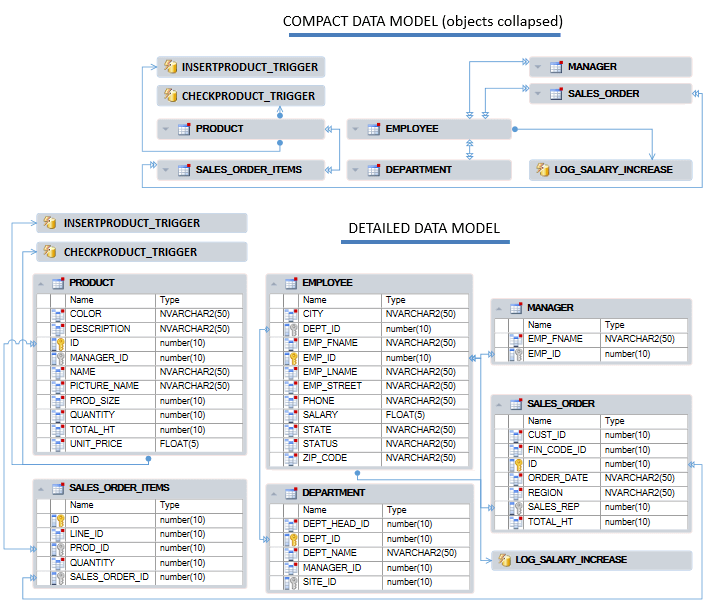
- A new diagram is generated in the treeview:
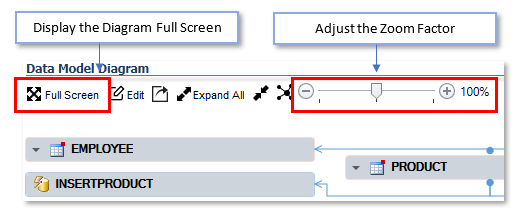
3. Display in Full Screen
- You can detach the Diagram and display it full screen
- You can also adjust the zoom factor to visualize a certain part of the Diagram.
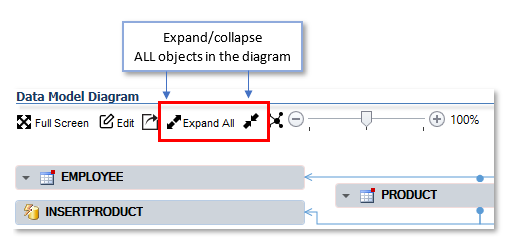
4. Expand & Collapse entities
- Each entity can be expanded (full details) or collapsed (name only), by clicking on the triangle before its name:
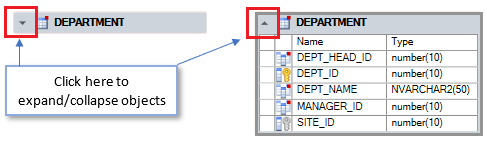
- You can expand/collapse all entities at the same time with these buttons:
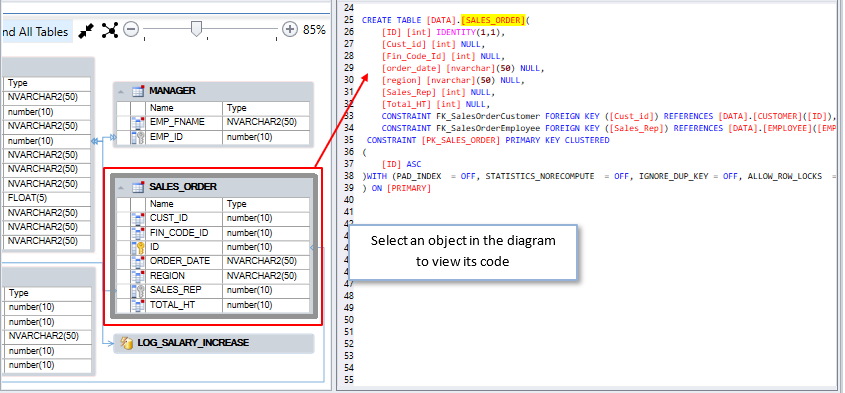
5. Visualize the code of each entity
- If you select an entity in the diagram, its code shows up in the source code view:
Edit a diagram
Read this article to edit and save a diagram
Share, Export, Print a diagram
Read this article to share, export, and print a diagram