Visual Expert offers a dedicated macro under Performance Analysis - Most Executed Objects to find objects that are executed very frequently and have a significant impact on the user experience.
Using this macro, you can examine and compare the most executed objects with the cumulative runtime results. This allows PowerBuilder developers to determine which objects should be addressed in priority to improve the application's performance.
You can choose the scope for this performance analysis from an entire application to one library, methods, objects, and so on.
Identify Most Executed Objects in an Entire PowerBuilder Application
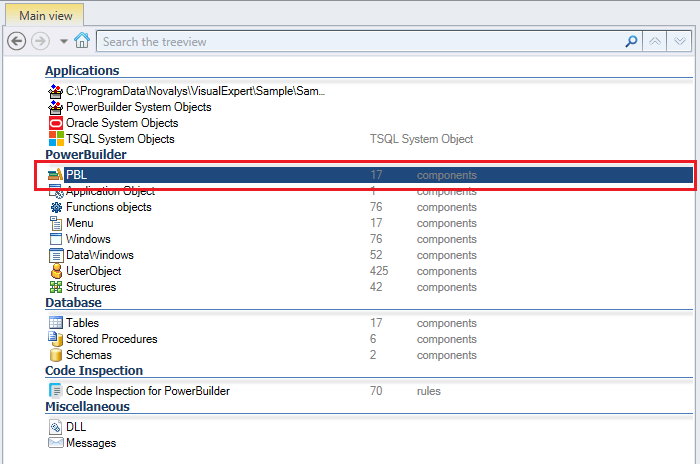
- Select the root of the PBL in the Main View.
This will include all the libraries present in your PB code.
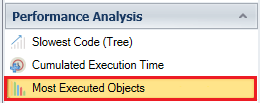
- In the Navigation Bar, go to Performance Analysis > Most Executed Objects
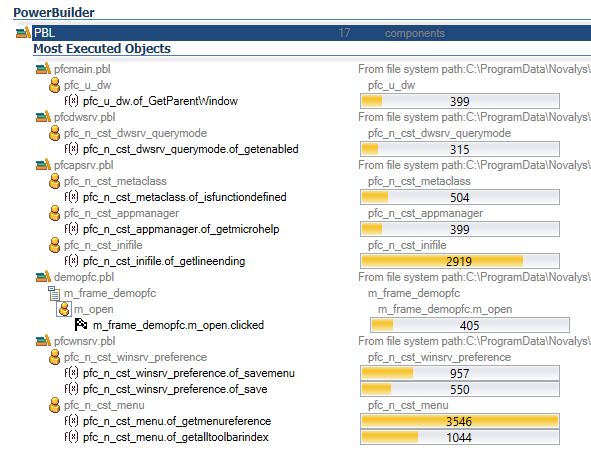
Visual Expert will display the top 10 objects - with the most number of executions count - in a container hierarchy.
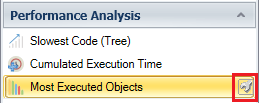
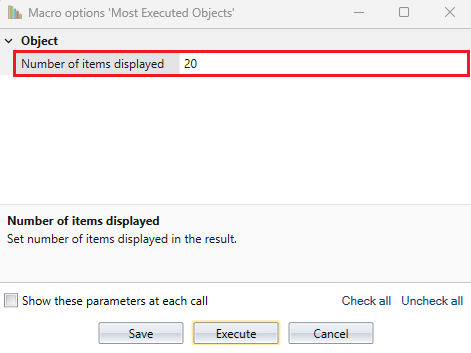
- Click on the wrench icon to open the macro options.
A new macro parameter window will open, wherein you can change the size of the list. - Change the number of items displayed from 10 to 20 and click on [Execute]. VE will then display the top 20 objects in the treeview, with the most number of executions count.
Identify Most Executed Objects in One Library
- Select any one library from all the PBLs available in the application.
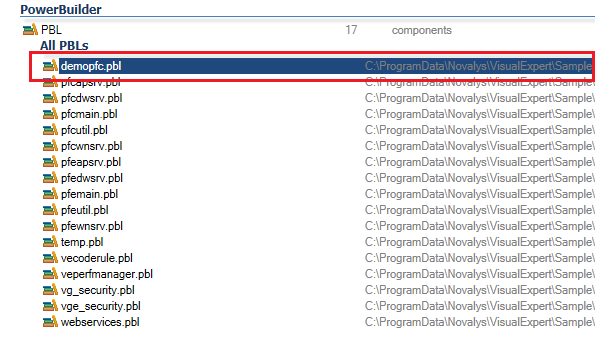
- Go to Performance Analysis > Most Executed Objects. (Same as above)
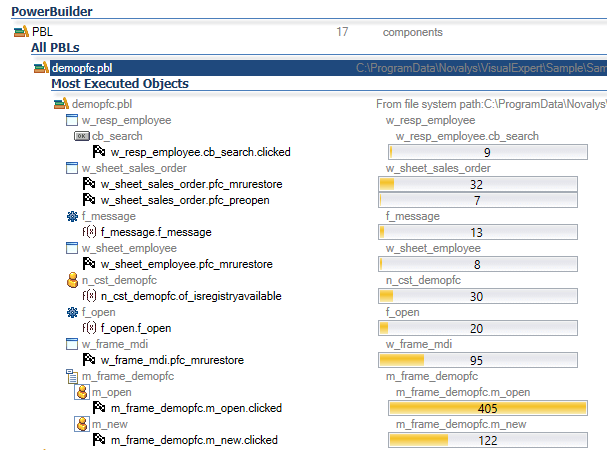
Visual Expert will display the top 10 objects or methods with highest execution count in that particular PBL.
Identify the Most Used Objects among a Selection of Items
- Select one or several (Ctrl+click) objects in the treeview.
- Go to Performance Analysis > Most Executed Objects. (Same as above)
Visual Expert will display methods with the most number of executions for each object selected in the list.
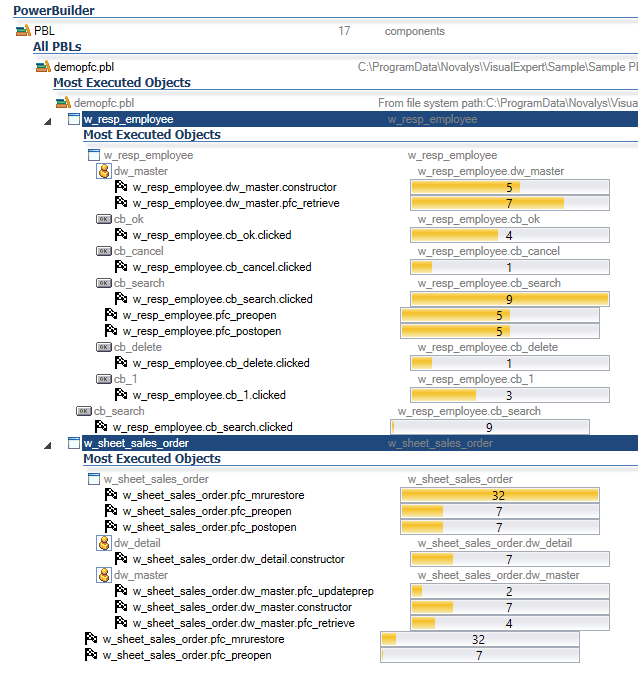
The PowerBuilder developers can review these results to work on the objects with the most number of executions and improve their impact on application performance.
