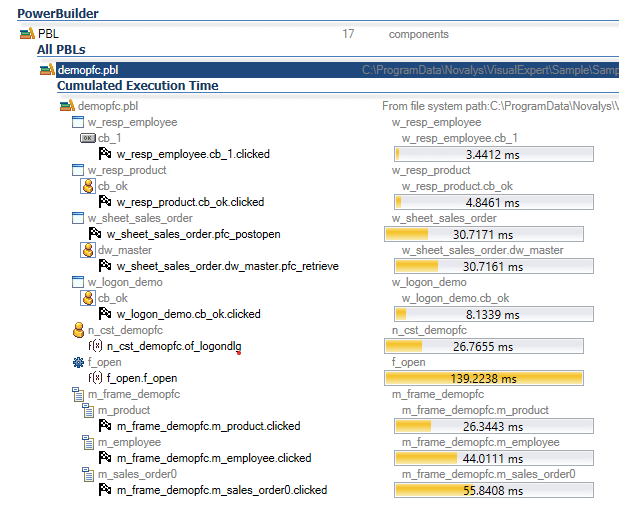
Visual Expert offers a dedicated macro under Performance Analysis - Cumulated Execution Time - to find objects consuming most of the users’ time while using the application.
Measurement formula: [Average execution time * number of executions]
Using this macro, you can review the objects that may not be slow in execution but are executed so often that they end up hurting the overall experience of your PowerBuilder application.
You can choose the scope for this performance analysis from an entire application to one library, methods, objects, and so on.
Optimize General Performance of PB Objects in an Entire PowerBuilder Application
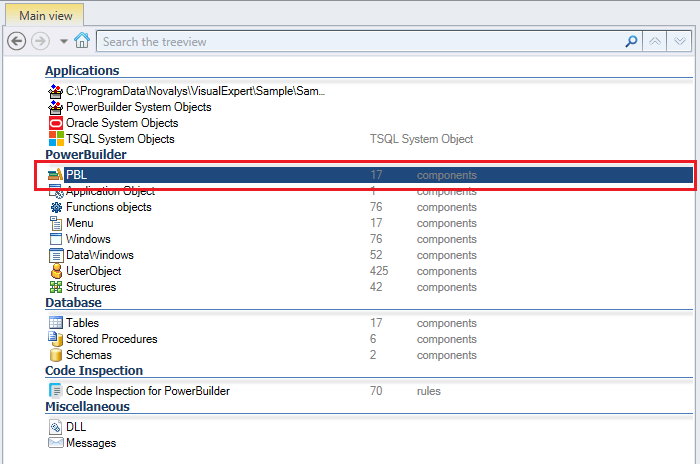
- Select the root of the PBL in the Main View.
This will include all the libraries present in your PB code.
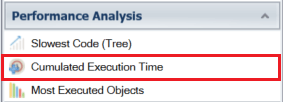
- In the Navigation Bar, go to Performance Analysis > Cumulated Execution Time
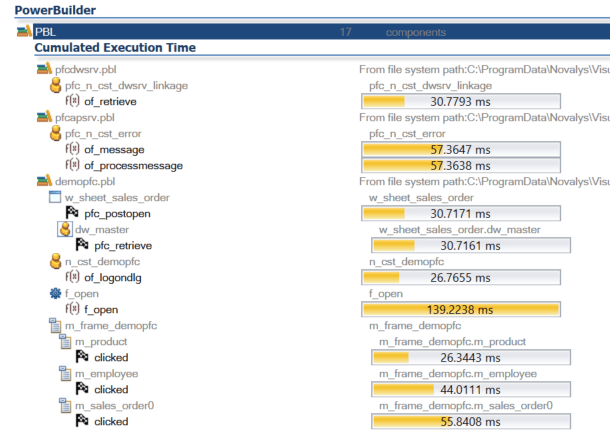
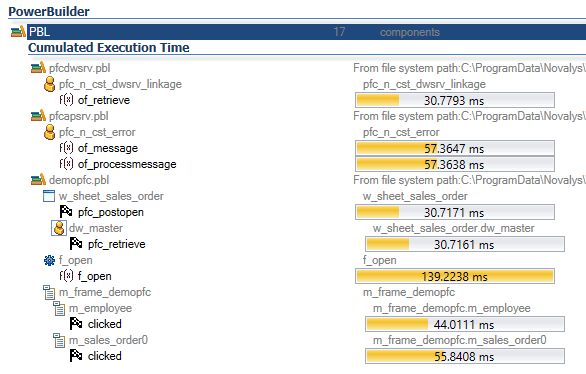
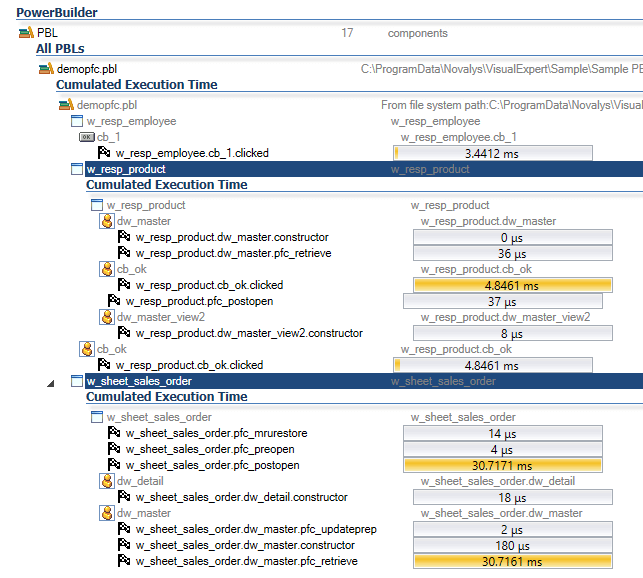
Visual Expert will display the top 10 objects - with the largest cumulated execution time - in a container hierarchy.
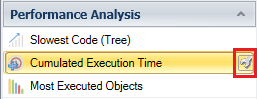
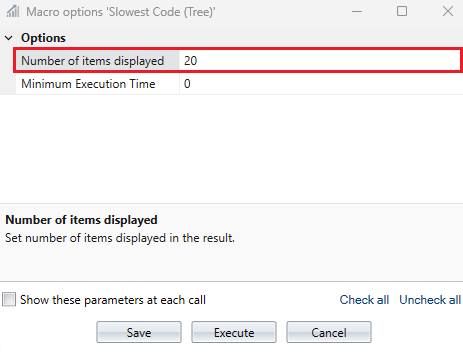
- Click on the wrench icon to open the macro options.
A new macro parameter window will open, wherein you can change the size of the list. - Change the number of items displayed from 10 to 20 and click on [Execute]. VE will then display the top 20 objects in the treeview, with the largest cumulated execution time.
- You can also specify the minimum execution time for an item to be displayed in the result of this macro.
For instance: 10 milliseconds, 20 milliseconds, 30 milliseconds and so on. Click on [Execute].
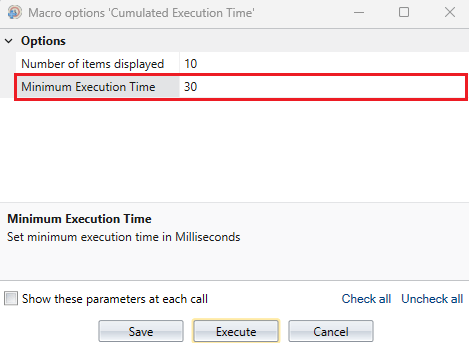
- VE will then only display objects that exceed the specified limit.
Optimize General Performance of PB Objects in One Library
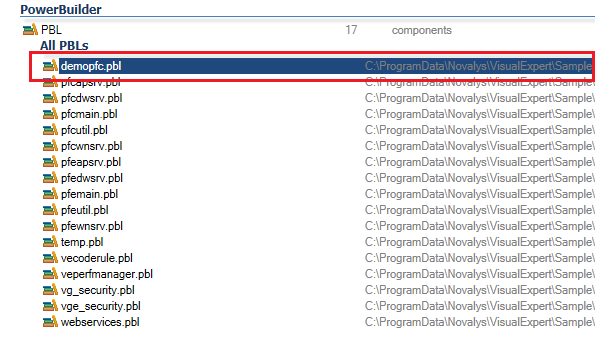
- Select any one library from all the PBLs available in the application.
- Go to Performance Analysis > Cumulated Execution Time. (Same as above)
Visual Expert will display the top 10 objects or methods with the largest cumulated execution time in that particular PBL.
For One or More Specific Object(s)
- Select one or more objects in the treeview.
- Go to Performance Analysis > Cumulated Execution Time. (Same as above)
Visual Expert will display methods taking most of users’ time for each object selected in the list.
Analyzing PowerBuilder objects with high cumulative execution time will allow PowerBuilder developers to improve the overall user experience of the application.