Set up Performance Analysis for PowerBuilder
Visual Expert helps to improve the performance of PowerBuilder code, by analyzing application execution statistics, generated by multiple machines and user sessions.
This tutorial describes how to enable performance tracing and identify the code that needs to be tuned to improve the overall performance of a PowerBuilder application.
Step 1: Collecting Application Usage data
- It is mandatory to add the PBL provided by Visual Expert to your application. This PBL will generate a trace file anytime there is a new user session. For multiple workstations, one file will be generated per user session and workstation.
- These trace files will consist of statistical data gathered from the execution of application objects. Visual Expert will use this data to analyze code performance and display results in graphical format.
- The trace files will be created in a common folder, so that VE can find them and include them in its static code analysis process.
Activate PB Code Performance Tracing in the PowerBuilder Application
- Open your application in the PB IDE
- Add the veperfmanager.pbl file. It contains the functionality to extract performance analysis for executed functions or events.
Location of veperfmanager.pbl
C:\Program Files\Novalys\Visual Expert 2023\PowerBuilderPerformance
-
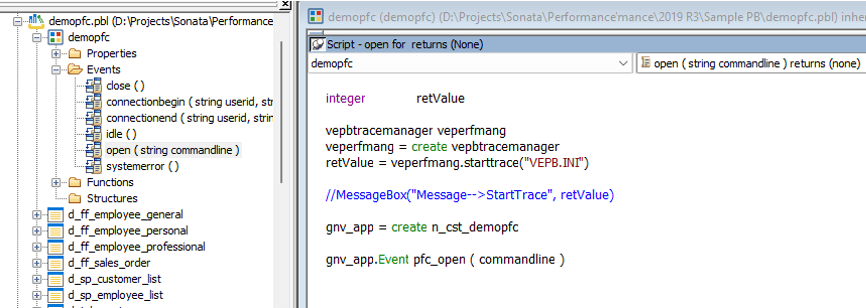
Once the VEPerfManager PBL is added to the application,
enter the following code in the application startup to record performance data.
      //Start Tracing
      vepbtracemanager veperfmang
      veperfmang = create vepbtracemanager
      veperfmang.starttrace("VEPB.INI")
For Example:
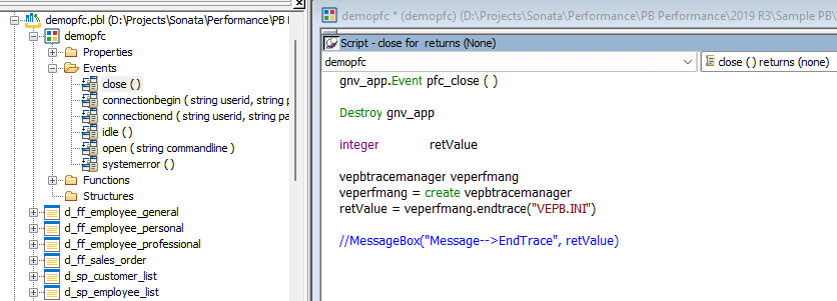
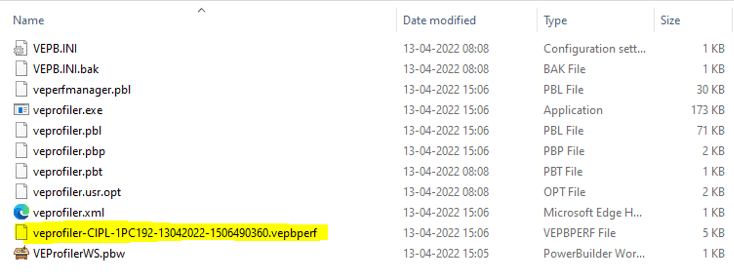
- Enter the below code when closing the application to stop tracing performance data. The *.vepbperf file will be generated containing the performance data of that session
      //Stop Tracing
      vepbtracemanager veperfmang
      veperfmang = create vepbtracemanager
      veperfmang.endtrace("VEPB.INI")
For Example:
StartTrace and EndTrace methods use the VEPB.INI file as input.
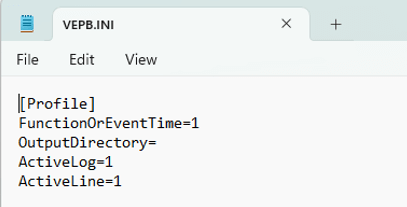
This file contains the default configurations required to create the output file along with the parameters to be measured. (See below)
- FunctionOrEventTime=
This field allows you to decide whether to include the functions and events in the performance analysis by VE. The field value can be either 1 or 0 respectively.
For instance:
FunctionTime=1 → indicates to include functions
EventTime=1 → indicates to include events
FunctionOrEventTime=1 → indicates to include both functions and events
ActiveLog=1 → provides more information when a user faces difficulties using the PB Performance functionality - OutputDirectory=
This field sets the output directory path for the performance file(*.vepbperf). By default, it will use the folder containing the PB target.
- FunctionOrEventTime=
- On closing the application, the .vepbperf file is generated as shown above.
Step 2: Analyzing and Visualizing the Data
- Create a VE project combining the PB source code and the performance data stored in the .vepbperf file.
- That will enrich the description of the application’s structure with performance information.
- Create a Visual Expert project including the vepbperf file.
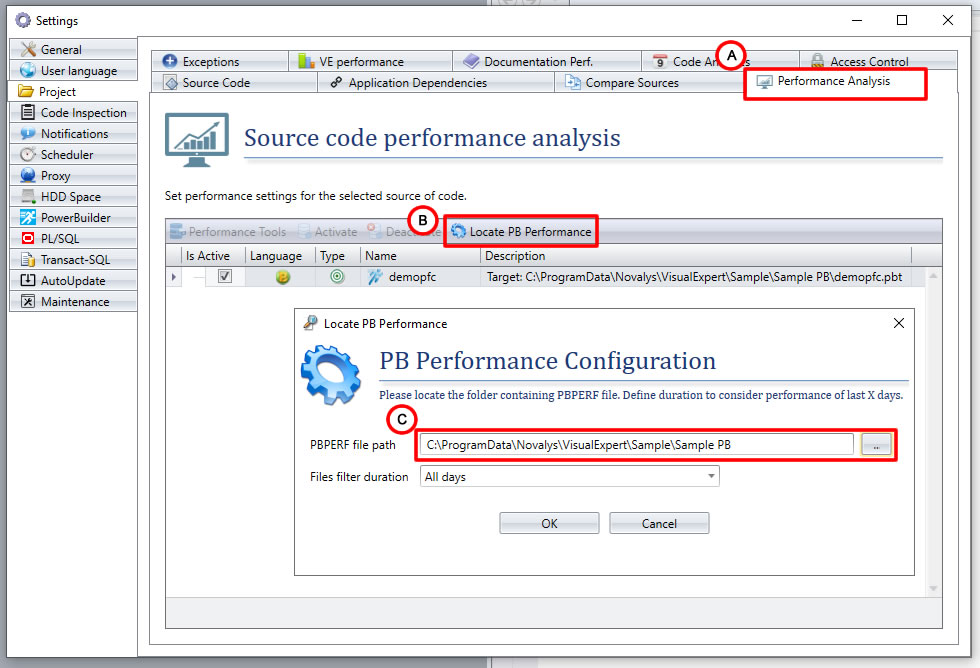
- To do so, open the [Project] section in the ‘More Settings’ window.
Go to Performance Analysis > Locate PB Performance. - Insert the vepbperf file path located on your PC. Click [OK].
- Run a new analysis or refresh the analysis of your PowerBuilder project.
Visual Expert will take into account the new performance statistics recorded in vepbperf each time you run a new analysis.
In the Navigation Bar, you will see a new set of macros under the [Performance Analysis] group.
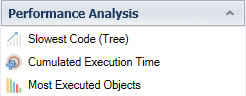
Each macro analyzes the performance of your PowerBuilder application from different angles. The visual representation of execution times, combined with the call graph, allows developers to identify and locate slow PowerBuilder code that should be improved.
Know more about Visual Expert Performance Analysis for PowerBuilder Apps
- Identify Slow Code and Bottlenecks - Tutorial
- Improve PB App User Experience - Tutorial
- Identify Most Executed Objects - Tutorial
- Perform General Review of PB App - Use Case
- Improve Specific Feature in PB App - Use Case