
Defect List
The Defect List shows the defects found by the analysis in a single table. Each row is one defect, with its severity, status, rule, container and associated task.
To open the list, click a figure on the dashboard, an entry of the side menus, or All Defects for the complete set.

Columns
- Defect Id – The unique identifier of the defect, such as VE-591. Selecting it opens the defect.
- Rule – The coding rule that generated the defect.
- Container – The object, file, module or program where the defect was detected.
- Severity – The severity of the defect, shown as a dropdown: it can be changed directly from the list. The levels are described in Concepts.
- Type – The category of the defect: Bug, Maintainability, Vulnerability, Security warning or Metric.
- Score – The impact score of the defect, calculated from its severity and its number of occurrences. See Score.
- Occurrences – How many times the rule is broken in this container. Each occurrence is listed with its line number when the defect is opened.
- Status – The current lifecycle stage of the defect, shown as a dropdown. The statuses are described in Concepts.
- Last Detected – The most recent analysis date on which the defect was found.
- Last Analysis – The analysis run in which the defect was last evaluated.
- Task Id – The task created from this defect, such as TSK-1. Selecting it opens the task.
- Updated Date – The last date on which the defect information was modified.
- Resolved in Analysis – The analysis in which the defect stopped being detected.
Score
How the score is calculated
The score of a defect is the product of its severity weight and its number of occurrences.
For example, a Major defect (weight 100) with 4 occurrences has a score of 100 × 4 = 400.
Severity weights
- Information – 1
- Low – 1
- Minor – 5
- Major – 100
- Critical – 1000
Using the score
The score helps you:
- identify the defects with the highest severity or the most occurrences;
- prioritise defects for investigation and remediation;
- compare the relative impact of defects within the application.
The score is not a percentage or a probability. It depends only on the severity weight and the number of occurrences.
Toolbar
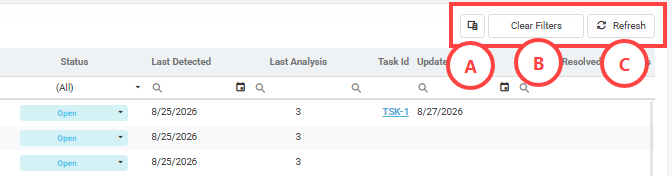
- A. Column Chooser – Shows or hides columns. Each user can keep only the columns their work requires.
- B. Clear Filters – Removes all applied filters and restores the complete list.
- C. Refresh – Updates the list with the latest available information.
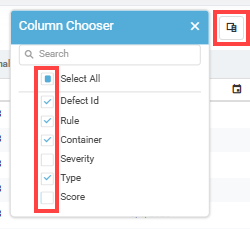
These three controls are available in Visual Expert Web.
Filters and search

The row under the column headers filters each column individually: a dropdown where the values are known, a search box otherwise.
The filters currently applied are listed at the bottom left of the list.
Opening and selecting defects
- Click a row – The defect details open in the right-hand panel. See Defect Details.
- Select the checkbox of a row – An action bar opens at the bottom of the list. See Manage defects from a list and Act on several defects at once.
Related procedures
- Narrow a defect list - Triaging defects
- Change the severity of a defect - Triaging defects
- Record a false positive, an accepted risk, or put a defect on hold - Triaging defects
- Assign a defect to a developer - Triaging defects
- Act on several defects at once - Triaging defects