
Defect Dashboard
The Defect Dashboard summarises what the latest analysis found. Click a counter, a chart segment or a table cell to open the list of the defects it represents.
In Visual Expert Web, click the Code Inspection tab. The screen is headed Code Inspection and shows the analysis date at the top right.
In Visual Expert Desktop, the dashboard opens when you open the project, or when you click the home icon in the Main view or the project node at the top of the tree.
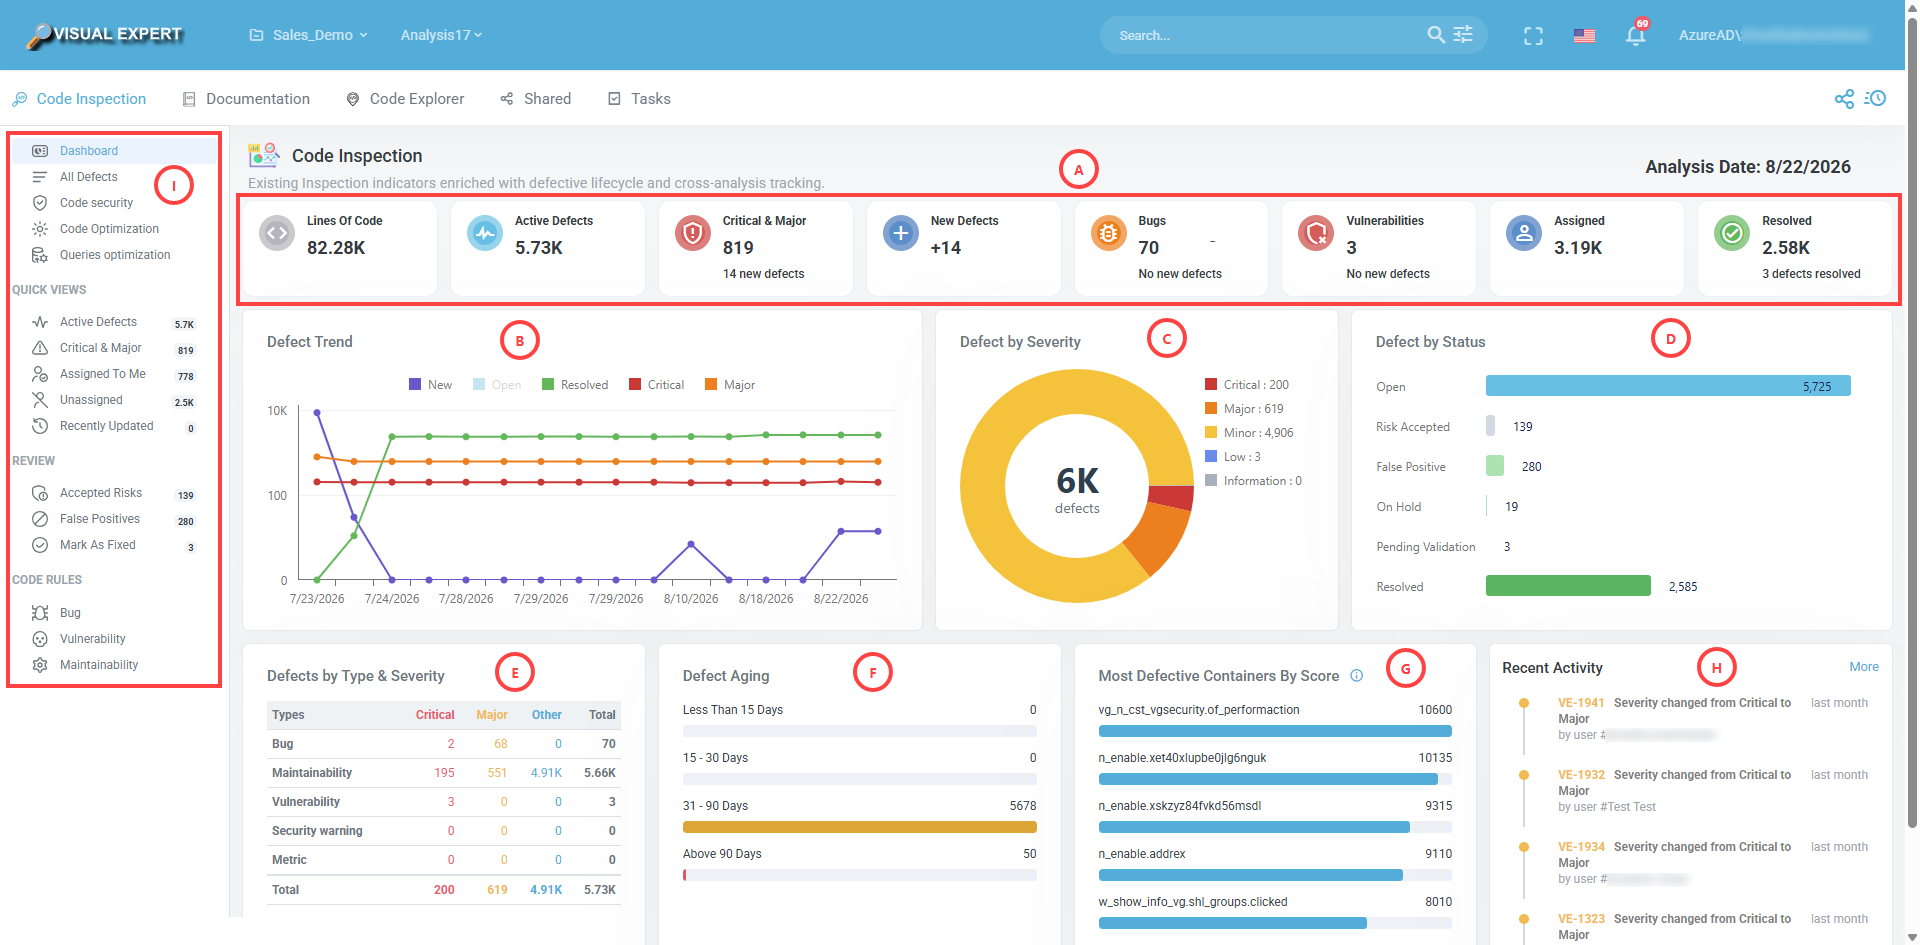
Counters
The row of counters (A) gives the state of the application at the date of the analysis. Under each figure, a second line reports what changed since the previous analysis - for example "No new defects", or "234 defects resolved".
- Lines of Code – The size of the analysed application.
- Active Defects – All defects that have not been resolved or dismissed.
- Critical & Major – Defects at the two highest severity levels.
- New Defects – Defects detected for the first time by this analysis.
- Bugs – Active defects of type Bug.
- Vulnerabilities – Active defects of type Vulnerability.
- Assigned – Defects that have a task and an assignee.
- Resolved – Defects no longer detected by this analysis.
Defect Trend (B)
How the defect count has moved across successive analyses. One point is added per analysis, and the series – New, Open, Resolved, Critical, Major – can be shown or hidden from the legend.
Defect by Severity (C)
A donut chart giving the share of each severity level, with the total in the centre.
Defect by Status (D)
Horizontal bars comparing the number of defects in each lifecycle status, which shows how much of the backlog has been triaged.
Defects by Type & Severity (E)
A table crossing the five defect types - Bug, Maintainability, Vulnerability, Security warning, Metric - with Critical, Major and Other, plus a total per row and per column. Any cell opens the matching filtered list.
Defect Aging (F)
Defects grouped by how long they have been open: Less Than 15 Days, 15 - 30 Days, 31 - 90 Days, Above 90 Days.
Most Defective Containers By Score (G)
Containers ranked by score, highest first. Each row shows the container, its score, and a bar comparing it with the others.
A container score is the total of the scores of the defects it contains. See Defect List for how a defect score is calculated.
Recent Activity (H)
The latest changes made to defects - assignment to a task, status changes - each with the defect identifier, the user and how long ago it happened. Selecting an entry opens the defect. The More option opens the full history.
Side menus (I)
The menu beside the dashboard gives direct access to the views used most often. Each entry opens a defect list already filtered, and carries its current count.
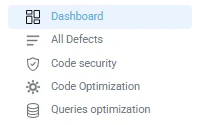
Dashboard returns to this page. All Defects opens the unfiltered list. Code security, Code Optimization and Queries optimization group the defects that affect each of those concerns, whatever the type of the rule that produced them - a rule classified as Maintainability can still degrade performance, and is counted here.
Quick Views
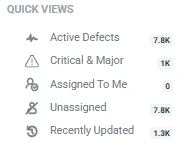
- Active Defects – All defects still to be dealt with.
- Critical & Major – The two highest severity levels.
- Assigned To Me – Defects whose task is assigned to the current user.
- Unassigned – Defects that have no task yet.
- Recently Updated – Defects changed most recently.
Review
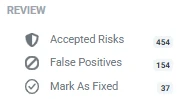
- Accepted Risks – Defects recorded as known and accepted risks.
- False Positives – Defects reviewed and found not to apply.
- Mark As Fixed – Defects a developer has declared corrected, waiting for the next analysis to confirm.
Code Rules
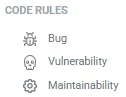
Bug, Vulnerability and Maintainability open the rules of that type rather than the defects, with the category chart and the rule list. Selecting a rule then opens the defects that break it.
Related procedures
- See the state of the application after an analysis - Triaging defects
- Find the defects added since the last analysis - Triaging defects
- Open the defects behind a dashboard figure - Triaging defects
- Compare successive analyses - Following remediation progress
- Check the correction at the next analysis - Fixing defects