List of Code Inspection Profiles [Quality Check Levels]
Code Inspection Dashboard Sample
Sample dashboard displaying indicators resulting from Visual Expert Code Inspection.
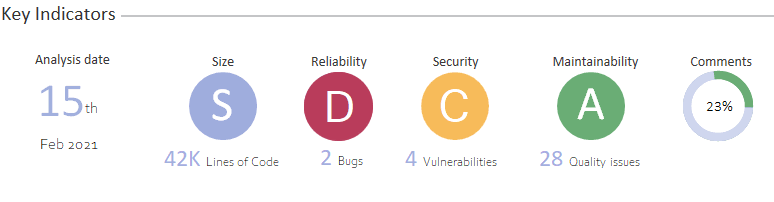
The code inspection dashboard displays indicators resulting from the static code analysis performed by Visual Expert. The letters are ratings calculated on a number of errors per 10,000 lines of code. Visual Expert code inspection profiles are based on this notation.
Below is a detailed explanation of the abbreviations used under key indicators:
- The Date on which the analysis has been conducted.
- The Size of the project in terms of number of lines of code.
S = Small (Less than 10K lines)
M = Medium (between 10K and 50K lines)
L = Large (More than 50K lines) - The Reliability rate is calculated according to the number of bugs per 10k lines of code.
A = 0 issue for 10K lines of codes
B = 1 issues for 10K lines of codes
C = 2 issues for 10K lines of codes
D = 4 issues for 10K lines of codes
E = 6 or more issues for 10K lines of codes - The Security rate is based on the number of security vulnerabilities detected in the code
A = 0 issue for 10K lines of codes
B = 1 issues for 10K lines of codes
C = 2 issues for 10K lines of codes
D = 4 issues for 10K lines of codes
E = 6 or more issues for 10K lines of codes - The Maintainability rate depends on the number of quality issues
A = 0 issue for 10K lines of codes
B = 1 issues for 10K lines of codes
C = 2 issues for 10K lines of codes
D = 4 issues for 10K lines of codes
E = 6 or more issues for 10K lines of codes - The Comments indicator is the ratio of comment lines to the total number of lines.
How to Setup Code Inspection Levels?
Here is a quick summary of steps to customize code inspection profile setup.
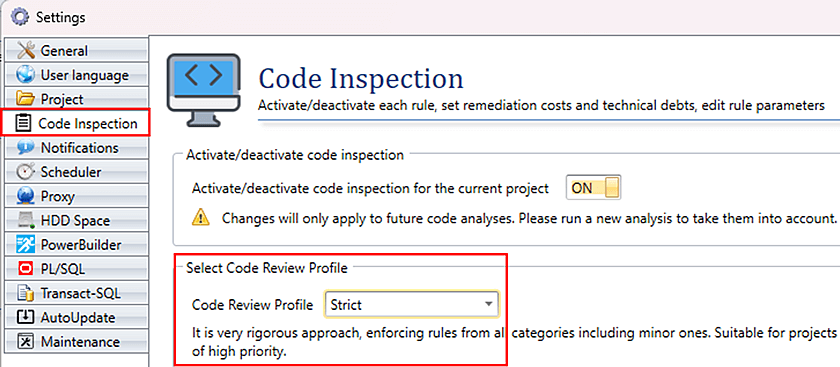
Go to Settings → More Settings → Code Inspection → Select the appropriate profile from the dropdown menu. Read the complete tutorial for more information.
Understanding Code Inspection Profiles
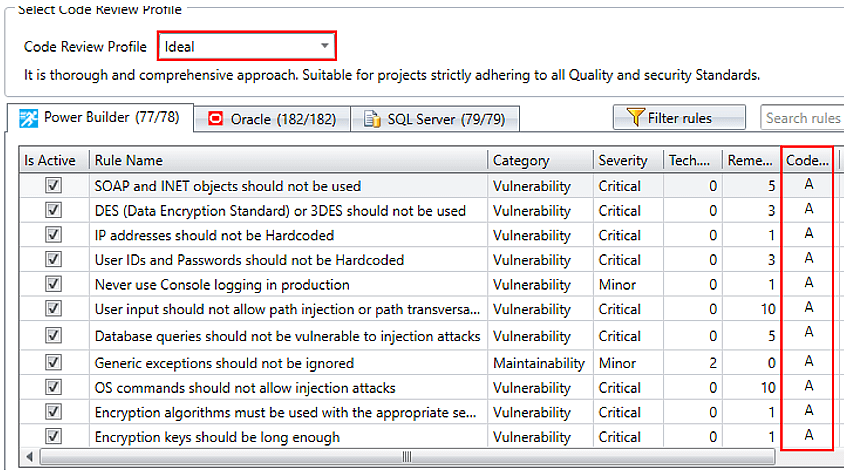
A - Ideal
This profile adopts a comprehensive and meticulous approach, making it appropriate for projects that strictly adhere to all quality and security standards.
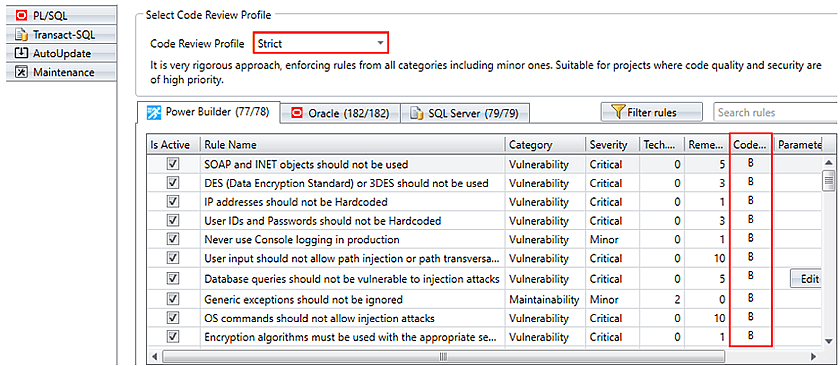
B - Strict
It is a very rigorous approach, enforcing rules from all categories including minor ones. Suitable for projects where code quality and security is of high priority.
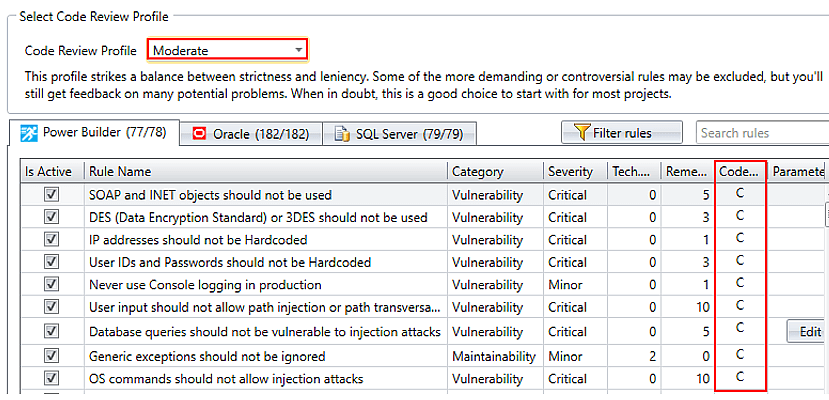
C - Moderate
This profile balances strictness and leniency. Some more demanding or controversial rules may be excluded, but you’ll still get feedback on many potential problems. When in doubt, this is a good choice to start with for most projects.
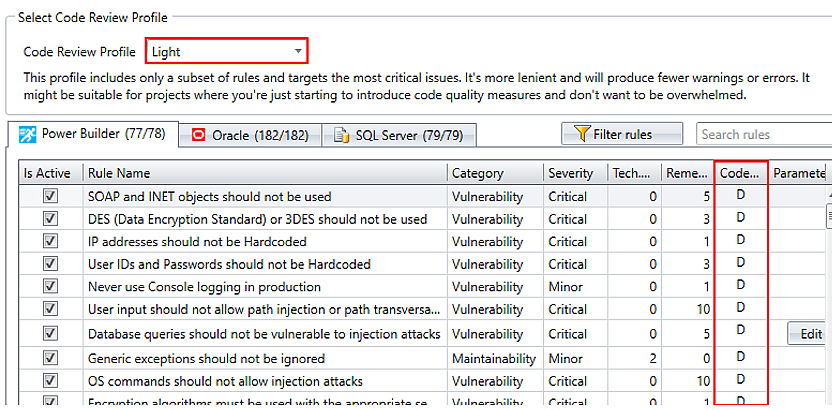
D - Light
This profile includes only a subset of rules and targets the most critical issues. It is more lenient and will produce fewer warnings and errors. Suitable for projects getting introduced to code quality measures without getting overwhelmed.
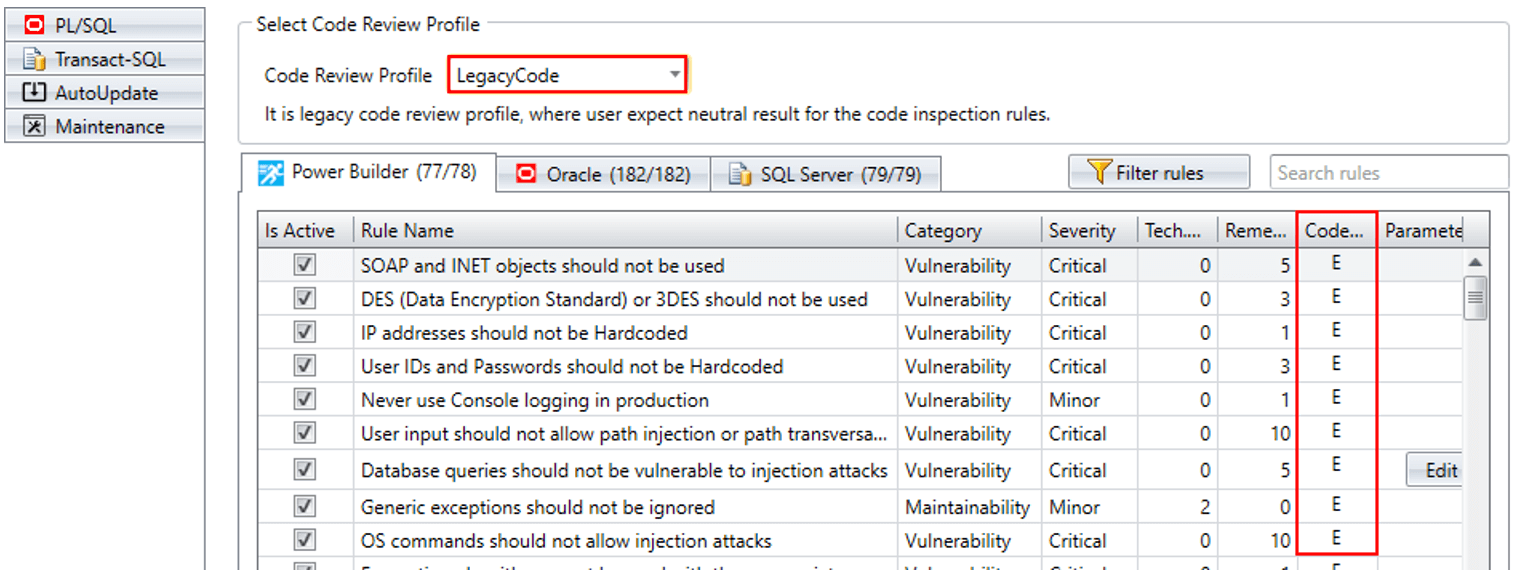
E - Legacy Code
This is a profile for reviewing old code, when users want neutral results for checking the code rules.
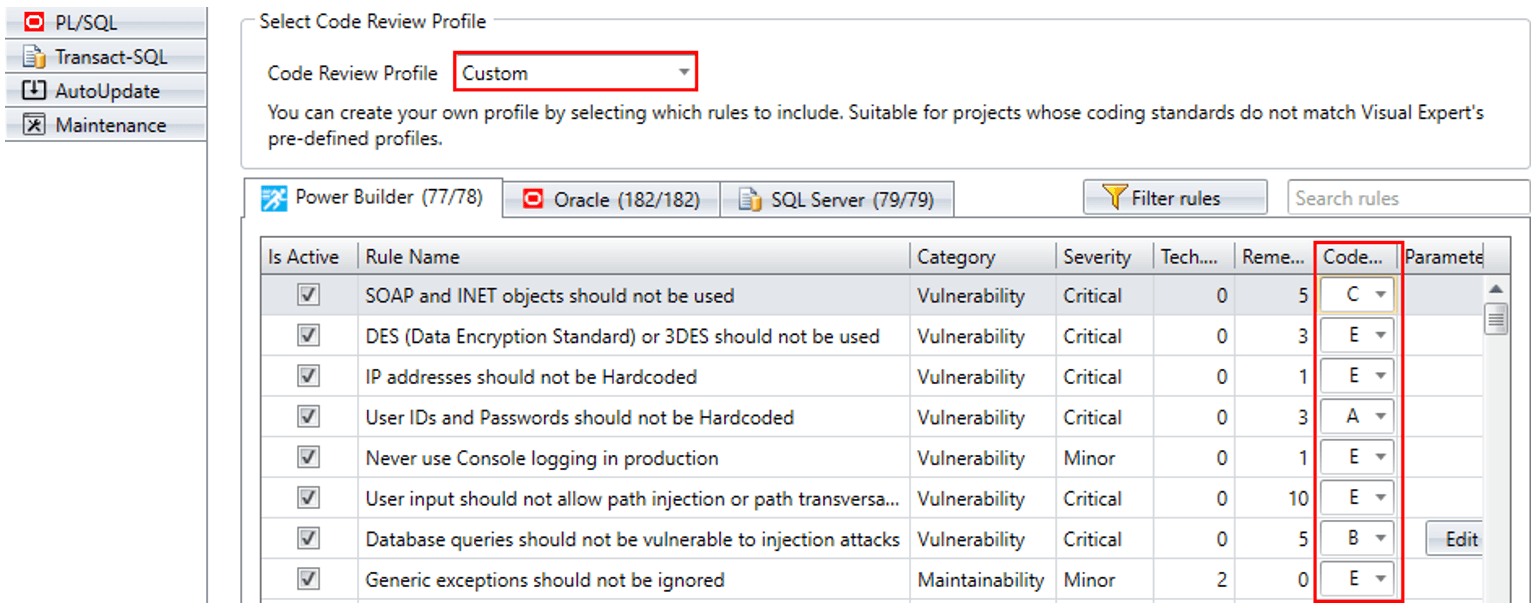
Custom
Users can create their profiles by choosing rules from the dropdown, making it suitable for projects where high priority is given to code quality and security.
Reviewing Code Profile Results
After setting up the profile, follow these steps:
Click on [Code Inspection] → [All Issues] → See the results.
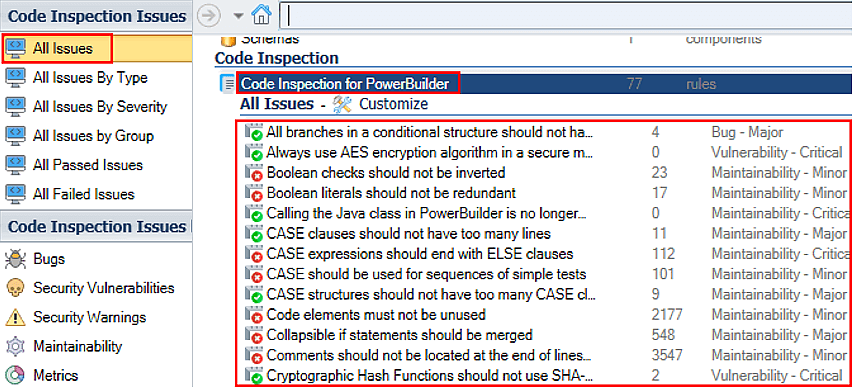
Sample 1 - Strict Profile Result
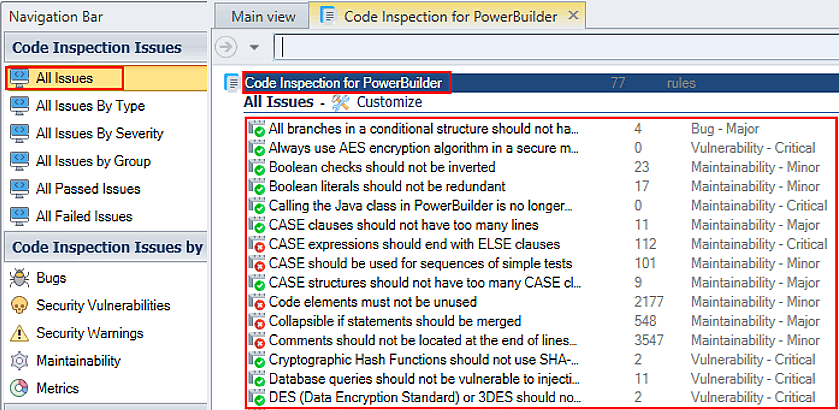
Sample 2 - Light Profile Result
Know more about Code Inspection Settings in Visual Expert
- How to Set Code Inspection Levels
- Code Inspection Settings
- Code Inspection Dashboard
- Generate Code Inspection Reports in JUnit and JSON Formats