- The Code Inspection Dashboard aims at:
- Visualizing high-level indicators after code inspection.
- Breaking down the issues detected by severity and type.
- Drill down in the code inspection results.
- Estimating remediation costs and technical debts.
How to View the Code Inspection Dashboard?
- Open Visual Expert.
- Analyze your PowerBuilder or DB code.
Note: you can analyze several applications within the same project (Read More) - The Dashboard opens in the right side of Visual Expert UI (Source Code View)
How to Drill Down into Code Inspection Analytics?
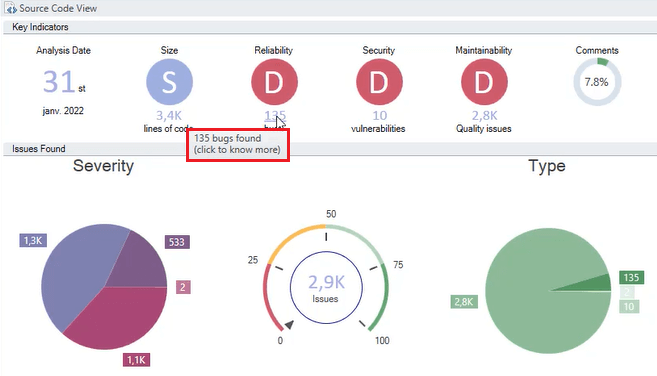
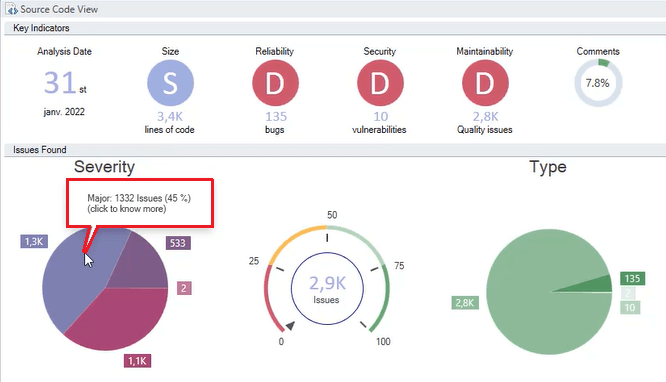
- Mouseover a chart or a metric on the dashboard.
You will see a graph tooltip with an invitation to view more information on a sub-dashboard.
- For instance, click on the [Major Issues] segment on the [Severity] chart.
- VE will open a sub-dashboard showing the evolution of code quality with [All Issues over time] and [Cost and Debt over time].
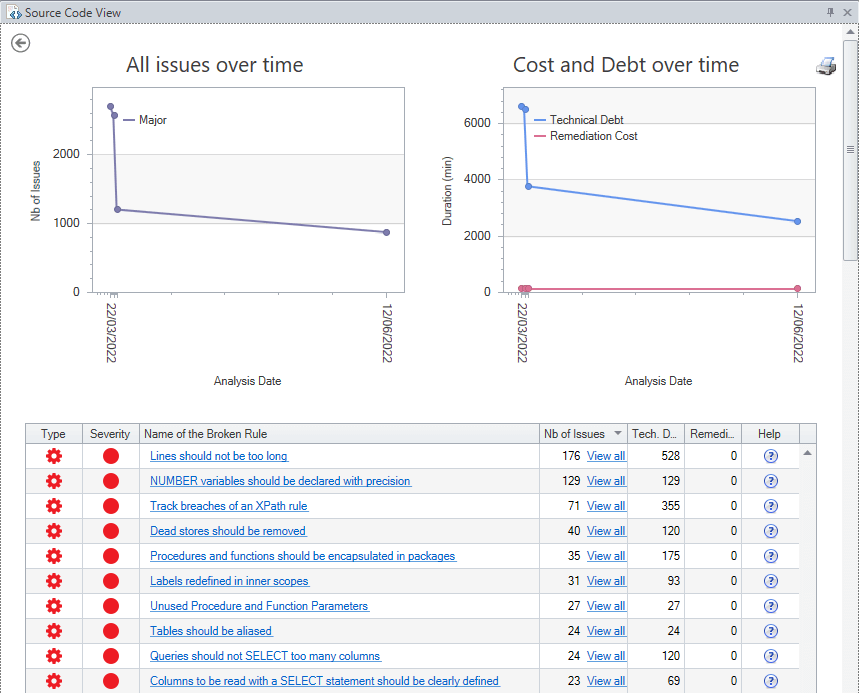
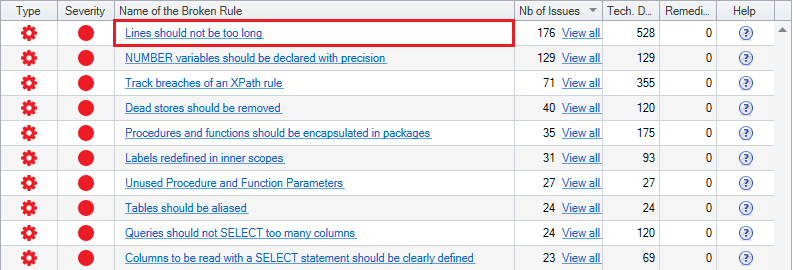
- Scroll down on the sub-dashboard to see:
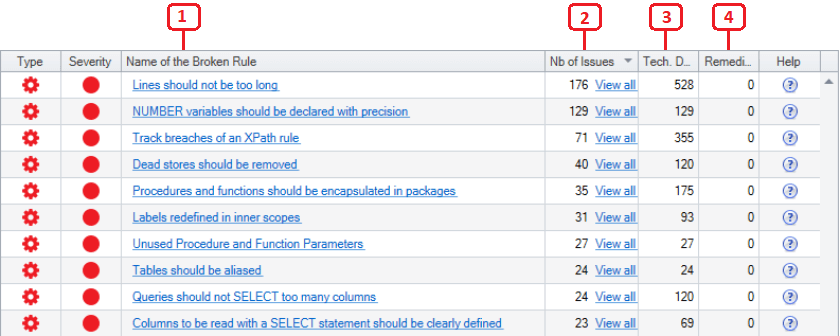
- A detailed list of broken rules,
- Number of issues per rule,
- Estimation of technical debt,
- An estimated remediation cost associated with each rule.
- Click on a particular rule, for instance: [Lines should not be too long].
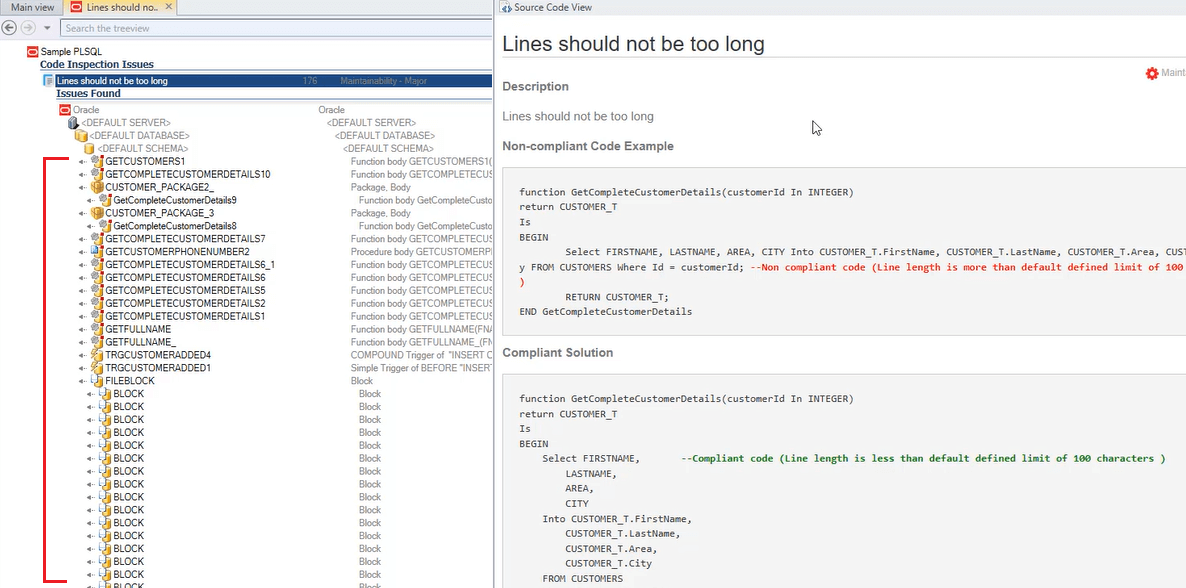
- VE will open a new page explaining the rule with an example of non-compliant and compliant code in Source Code View.
The list of objects breaking the rule will be displayed in the Main View.
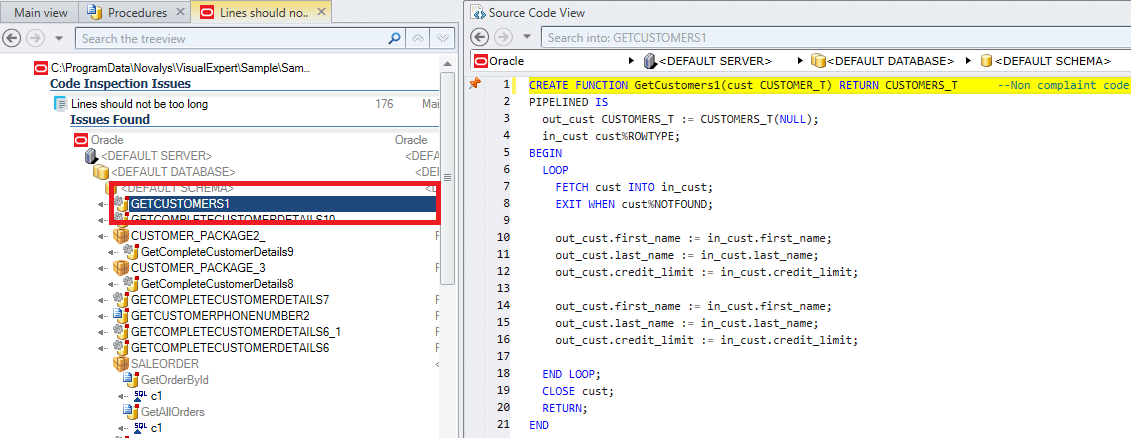
- On selecting an object in the Main View;
VE will highlight where the rule is broken in the code of that object.
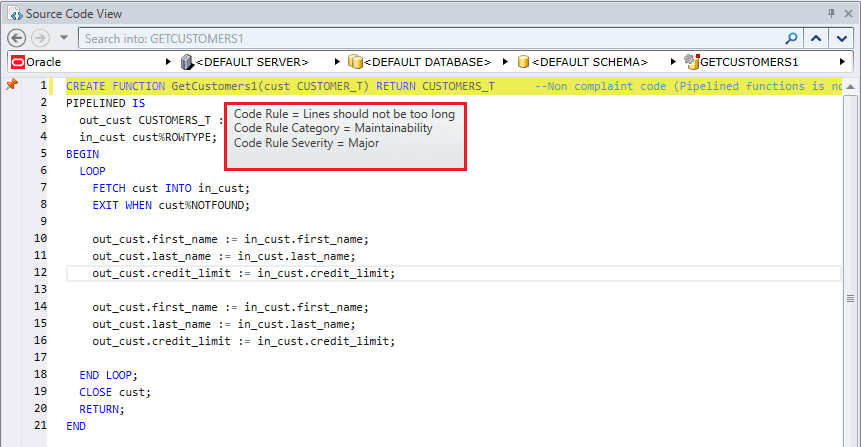
- Hover over the highlighted issue in the Source Code View.
A tooltip with the details of the broken rule appears to help you solve the problem.
- Go on object by object, and fix the issues one by one if needed.
How to Read Visual Expert Code Inspection Metrics
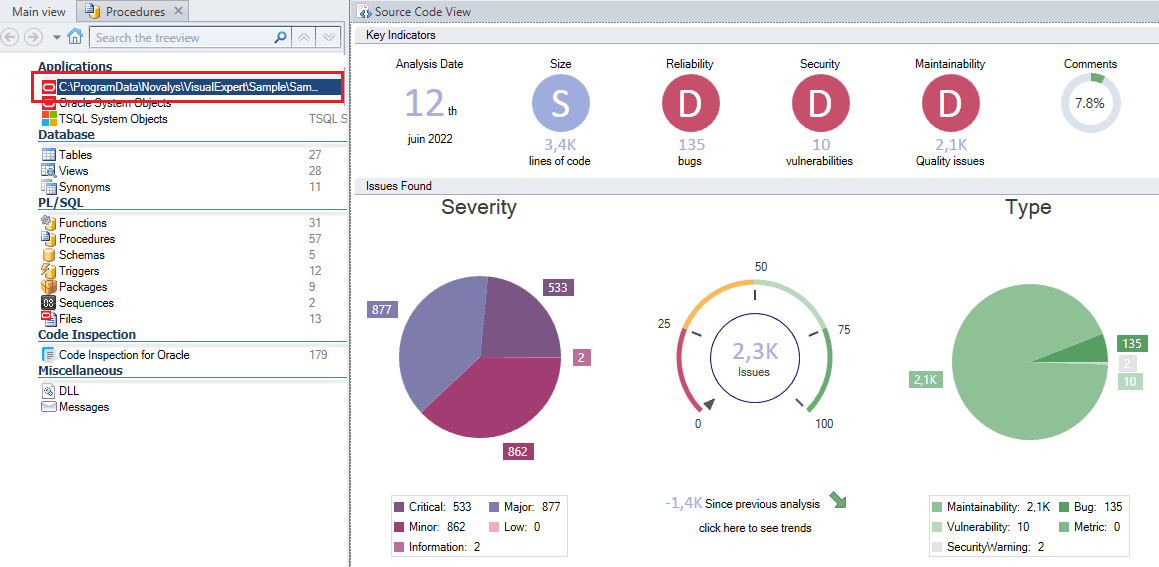
1. Key Indicators
This section of the Dashboard displays indicators resulting from Visual Expert Code Inspection.
The code inspection dashboard displays indicators resulting from the static code analysis performed by Visual Expert. The letters are ratings calculated on a number of errors per 10,000 lines of code. Visual Expert's code inspection profiles are based on this notation.
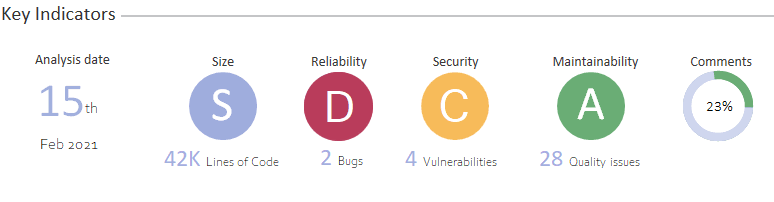
- The Date on which the analysis has been conducted.
- The Size of the project in terms of number of lines of code.
S = Small (Less than 10K lines)
M = Medium (between 10K and 50K lines)
L = Large (More than 50K lines) - The Reliability rate is calculated according to the number of bugs per 10k lines of code.
A = 1 issue for 10K lines of codes
B = 2 issues for 10K lines of codes
C = 4 issues for 10K lines of codes
D = 6 or more issues for 10K lines of codes - The Security rate is based on the number of security vulnerabilities detected in the code
A = 1 issue for 10K lines of codes
B = 2 issues for 10K lines of codes
C = 4 issues for 10K lines of codes
D = 6 or more issues for 10K lines of codes - The Maintainability rate depends on the number of quality issues
A = 1 issue for 10K lines of codes
B = 2 issues for 10K lines of codes
C = 4 issues for 10K lines of codes
D = 6 or more issues for 10K lines of codes - The Comments indicator is the ratio of comment lines to the total number of lines.
2. Issues Found
Visual Expert categorizes code inspection issues into types and levels of severity.
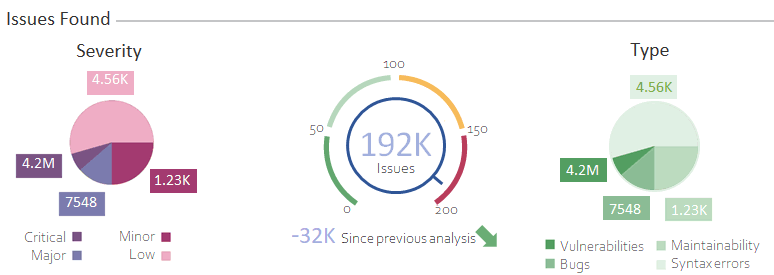
- The Severity chart shows the distribution of problems according to their impact and probability.
This indicates the percentage of problems that should be treated in priority. - The Gauge is an overview of the overall quality of the code.
The scale goes from 0 (red) for very bad to 100 (dark green) for very good.
This indicator is a ratio between the total number of issues and the number of lines of code.
In addition it displays the total number of errors, and its evolution compared to the previous analysis. - The Type chart shows the distribution of problems by types (bugs, maintainability issues, security vulnerabilities…).
3. Remediation Cost
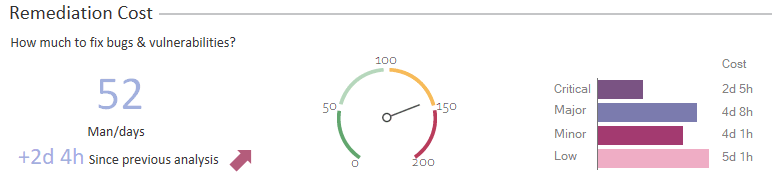
Visual Expert estimates the remediation cost for the language or application selected in the treeview.
This cost is expressed in man/days, considering the time needed to fix bugs and vulnerabilities.
The comparison between the last two analyses shows whether this cost is increasing or decreasing.
A bar chart breaks down this cost by severity, to refine the analysis and organize the corrective work.
4. Technical Debt
Visual Expert calculates the Technical Debt for the language or application selected in the treeview.
It is expressed in man/days, considering the time needed to fix maintainability issues.
The comparison between the last two analyses shows whether this debt is increasing or decreasing.
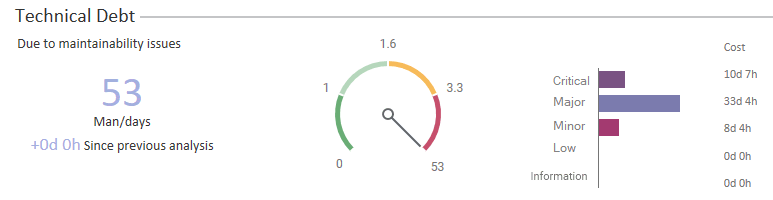
A bar chart breaks down this debt by severity, to refine the analysis and organize the corrective work.