Using PowerBuilder Code Profiling in a Real-life Application
After analyzing application performance with Visual Expert or in response to user feedback, you may need to profile your PowerBuilder code to identify which lines need to be refactored to improve the response time of a given feature.
Visual Expert allows you to generate a trace of your PowerBuilder code and analyze it to quickly identify the lines of code that consume the longest time in a given process.
This tutorial describes the results provided by Visual Expert and how to activate code profiling to identify PowerBuilder code that needs to be optimized to improve a slow feature.
Results of PowerBuilder Code Profiling with Visual Expert
Smart Profiling
Visual Expert delivers relevant, readable results by displaying in the treeview only those components that consume the most time in a process.
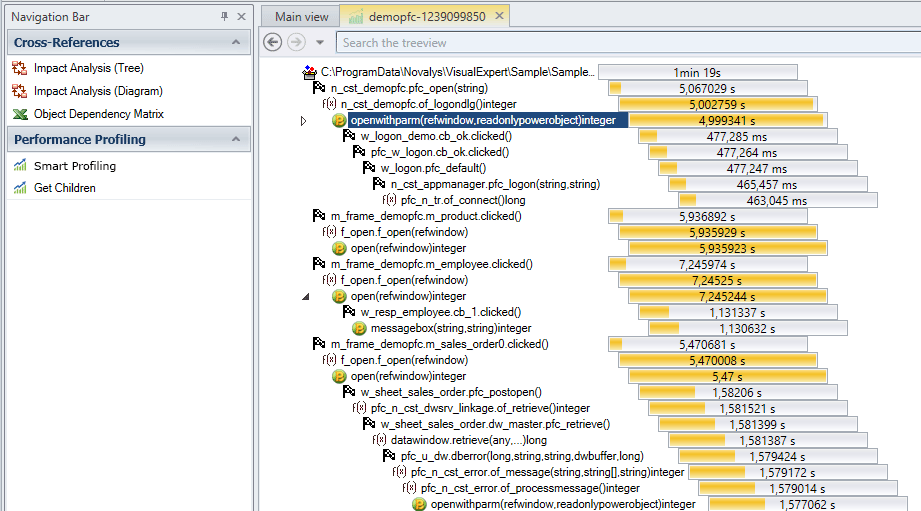
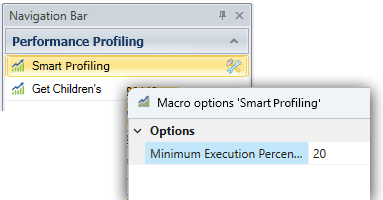
By default, only those items consuming more than 20% of a process's time are displayed.
You can change this setting by clicking on the wrench to the right of the macro.
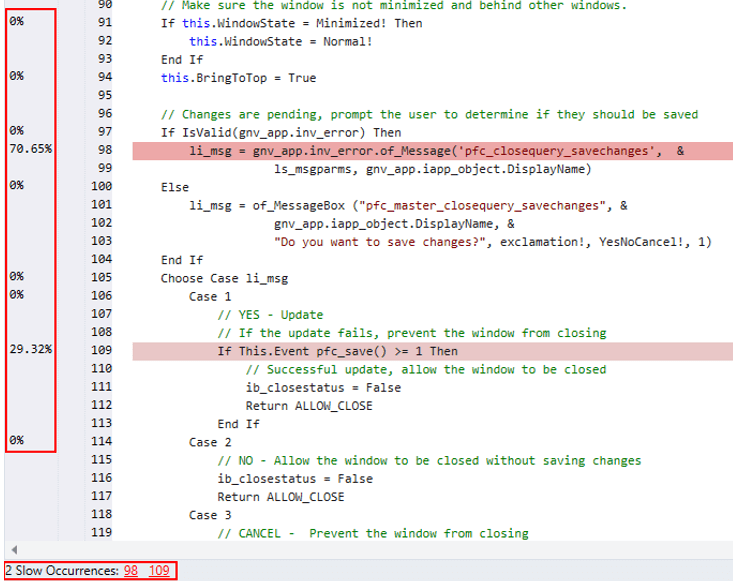
Select an item in the treeview to display its code.
Lines that consume the most time are highlighted in red in the source code view.
On the left, Visual Expert indicates the execution time of the line in question as a percentage.
For example, if a method takes 10 minutes to execute, and one line of code in that method takes 7 minutes to execute, that single line represents 70% of the total time taken to execute the method.
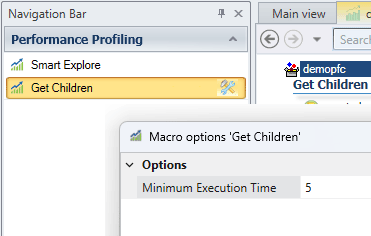
List Slow Legacy Items
The “Get Children” macro enables you to obtain a list of direct children whose execution time is longer than a certain duration.
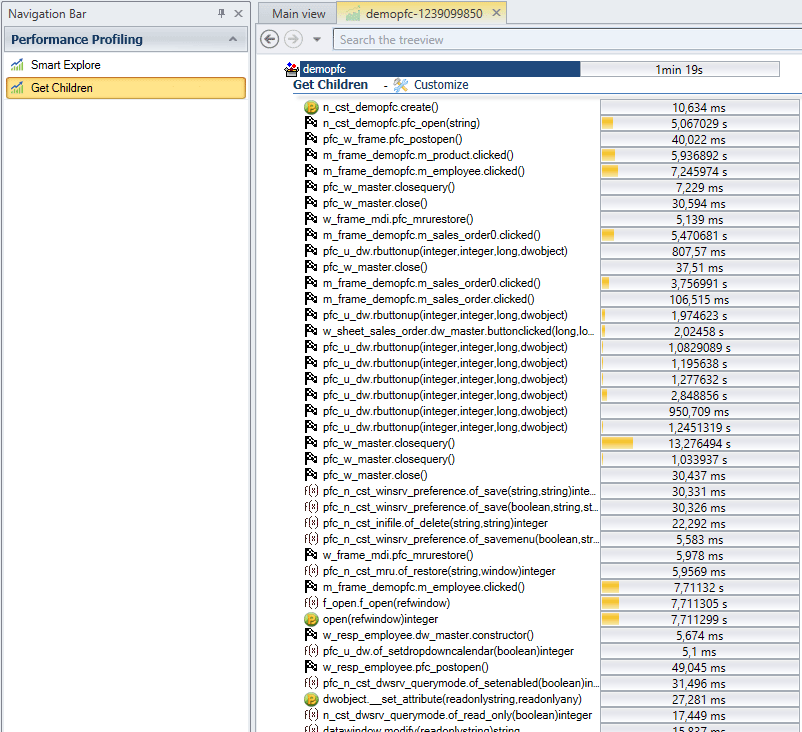
By default, Visual Expert displays children whose execution time is higher than 5ms.
You can change this setting by clicking on the wrench to the right of the macro.
How to Activate PowerBuilder Code Profiling with Visual Expert?
- Open your application in the PB IDE.
- Add the veperfmanager.pbl file. It contains the functionality to extract performance analysis for executed functions or events.
Location of veperfmanager.pbl
C:\Program Files\Novalys\Visual Expert 2024\PowerBuilderPerformance
-
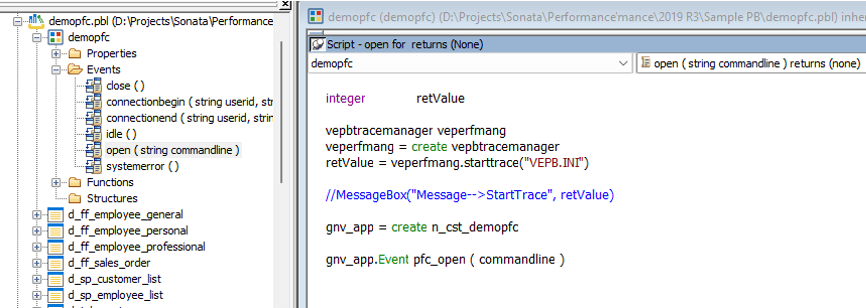
Once the VEPerfManager PBL is added to the application,
enter the following code in the application startup to record performance data.
      //Start Tracing
      vepbtracemanager veperfmang
      veperfmang = create vepbtracemanager
      veperfmang.starttrace("VEPB.INI")
For Example:
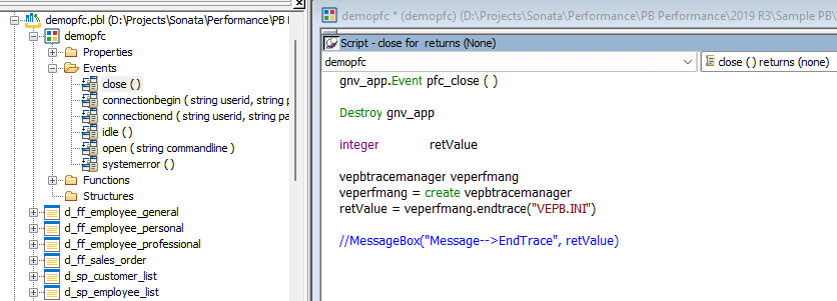
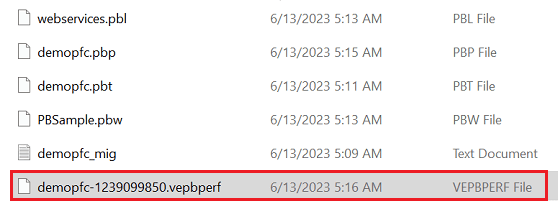
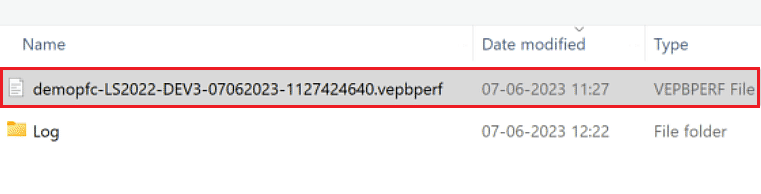
- Enter the below code when closing the application to stop tracing performance data. The *.vepbperf file will be generated containing the performance data of that session
      //Stop Tracing
      vepbtracemanager veperfmang
      veperfmang = create vepbtracemanager
      veperfmang.endtrace("VEPB.INI")
For Example:
StartTrace and EndTrace methods use the VEPB.INI file as input.
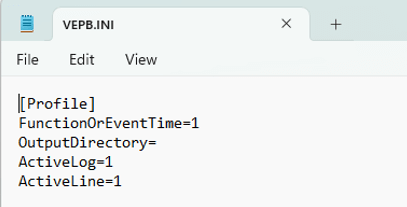
This file contains the default configurations required to create the output file along with the parameters to be measured. (See below)
- FunctionOrEventTime=
This field allows you to decide whether to include the functions and events in the performance analysis by VE. The field value can be either 1 or 0 respectively.
For instance:
FunctionTime=1 → indicates to include functions
EventTime=1 → indicates to include events
FunctionOrEventTime=1 → indicates to include both functions and events
ActiveLog=1 → provides more information when a user faces difficulties using the PB Performance functionality
ActiveLine=1 → provides timing information for each line of code
- OutputDirectory=
This field sets the output directory path for the performance file(*.vepbperf). By default, it will use the folder containing the PB target.
- FunctionOrEventTime=
- On closing the application, the .vepbperf file is generated as shown above.
- Now run Visual Expert → go to the Performance tab and click on [Open PB Performance File].

- Click the Open PB Performance File button, browse to the location of the VEPBPERF file, and open it.
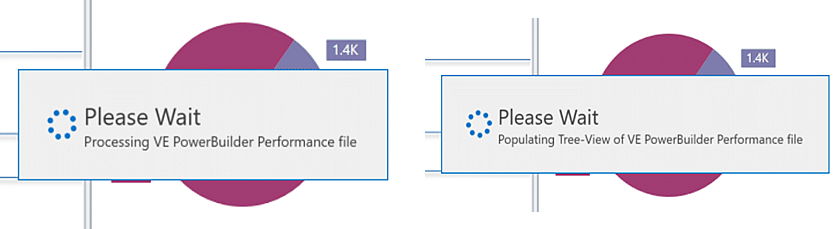
- Visual Expert will process the performance file and populate the resultant TreeView from the data.
Know more about Visual Expert Performance Analysis for PowerBuilder Apps
- Identify Slow Code and Bottlenecks - Tutorial
- Improve PB App User Experience - Tutorial
- Identify Most Executed Objects - Tutorial
- Perform General Review of PB App - Use Case
- Improve Specific Feature in PB App - Use Case