Visual Expert can generate a CRUD matrix - to analyze CRUD operations in your code (Create, Read, Update, Delete).
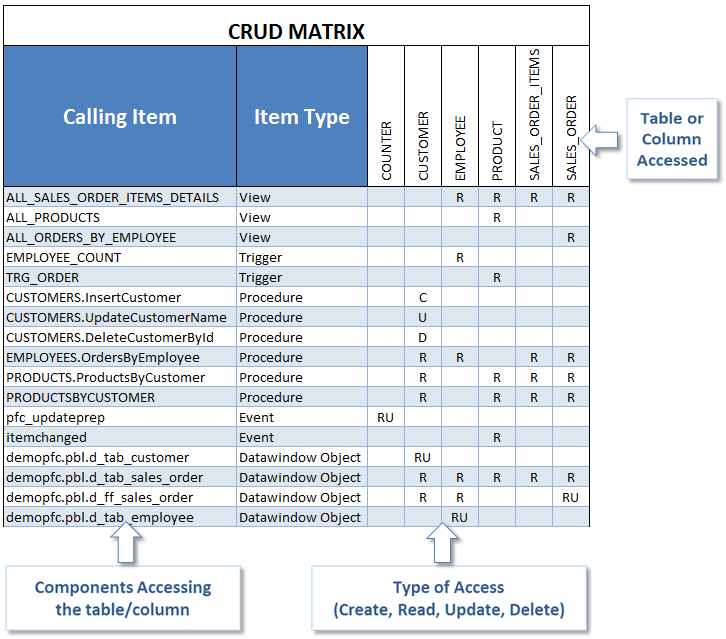
As a result, you can see which table is accessed by which objects (procedures, functions, etc.) with the type of access for each object:
This feature is particularly useful when modifying a table: the developer immediately visualizes all the SQL statements and application components that will be affected by the change, thus considerably reducing the risk of errors during maintenance.
Why use a CRUD matrix?
- Data Impact Analysis
Visualize how your application interacts with the database. Assess the potential impact of changes on data operations, whether they involve creating, reading, updating, or deleting data. - Optimized Database Management
Identify overused or underused database elements, ensuring efficient data flow and performance optimization. - Improved Code Maintenance
Map database operations directly to code components, making it easier to track and troubleshoot any code that interacts with the database. - Compliance & Auditing
Gain a clear view of how sensitive data is manipulated, ensuring adherence to data management policies and simplifying audits.
Visual Expert Web's CRUD matrix is interactive. Any cell can be used to access source code, run macros, and analyze impacts in PL/SQL, T-SQL, and PowerBuilder applications code.
Step-by-Step Guide to Using the CRUD Matrix
- Navigate to the Code Explorer section → Select the range of tables you wish to evaluate (e.g., Product > Person) → Under the Cross Reference section, click on CRUD Matrix.

- You will see the CRUD matrix results on the left side of the dashboard:
Create → Adding new records or data entries into the database.
Read → Retrieving existing data from the database.
Update → Modifying or updating existing data.
Delete → Removing data from the database, either permanently or temporarily.

Exploring the CRUD Matrix Dashboard
- Full-Screen View
Click the Open Full Matrix Results button (top-left corner) → Expand the page to view all matrix results.

- Search Functionality
Use the Search icon → Filter columns → Specify search criteria for tailored results.

- Information Icon
Click the Information icon → View detailed information about the selected calling item.

For instance, for d_ff_employee_general, you’ll see: - General Information
- Container Hierarchy
- DataWindow Columns
- DataSource Details
- DataWindow Details
- Code Inspection
- Calling Item Details
Click any calling item → View detailed information, including the source code → Run macros from the page for more analysis.

- Quick Macros
Right-click → Execute macros → Sort results by your preferred criteria.

