Analyze the performances of your database code with Visual Expert
Visual Expert 2019 introduces a new set of features to help analyze and improve the performances of your database code (procedures, functions, triggers, queries…)
For now, these features are available for:
- SQL Server databases with Transact-SQL code
- Oracle databases with PL/SQL code.
- Visual Expert projects connecting to your database to read the code (as opposed to reading your code from files).
This guide explains how to configure your project and review performances under 4 angles:
- Identify the slowest pieces of code in your application
- Analyze the queries accessing a given table
- Analyze the performance of a specific object
- Analyze the performance of a complete process
Configure your project
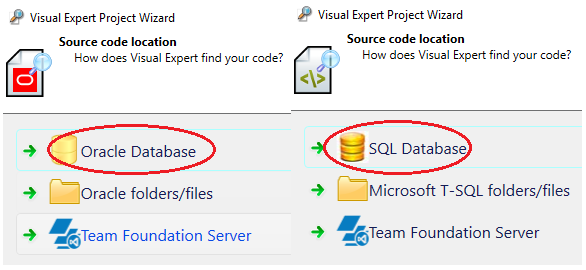
- Create a new Visual Expert project with Oracle or SQL server code
- Select your code from a database - NOT folders/files.
Which database will you analyze?
The choice of the database analyzed will determine from where you will collect performance statistics. Ideally, you would analyze a production database. If you don’t have the proper access rights for production, then a test or development database might work, as long as it is enough used to generate relevant performance statistics.- Specify and test your database connection.
- Start the code analysis.
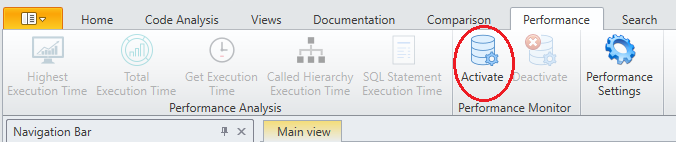
- Activate the code performance features.
When the analysis is completed, open the tab "Performance" in the Ribbon menu and click on "Activate".
[Oracle] This will configure Visual Expert to collect automatically some performance statistics, each time a new code analysis is starting.
After clicking on "Activate", Visual Expert will check it can access the required views and data in your Oracle database. An error message will pop up if an issue is detected.
[SQL Server] This will start generating automatically some performance statistics when your code is executed.
After clicking on "Activate":
- Visual Expert will check it has the necessary access rights for your database
- Attempt to create a performance event session in your SQL Server database
- Display a message if an issue is detected.
Please note, this feature is only available for:
- SQL Server 2012 and higher.
- Visual Expert projects reading DB code from a database, not from files.
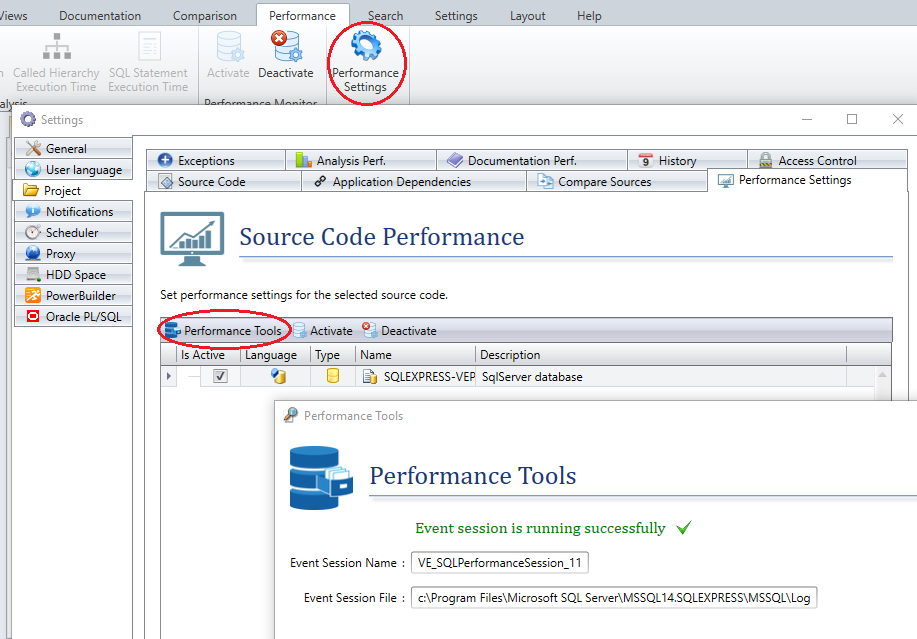
Alternatively, You may also Activate/Deactivate and see the details of the performance event session by opening "Performance Settings".
- [Oracle]
Refresh your code analysis (Ctrl+F5) once, to fetch the performance statistics from your Oracle database.
[SQL Server]
From this time on, each time a new code analysis will start, Visual Expert will collect the latest performance statistics available, and combine them with the analysis of your code. Please note that if you just activated this feature, you may need to wait for enough code to be executed, before getting relevant statistics.
- You can stop collecting execution statistics anytime:
Simply open the performance tab and click on "Deactivate"
Identify the slowest pieces of code
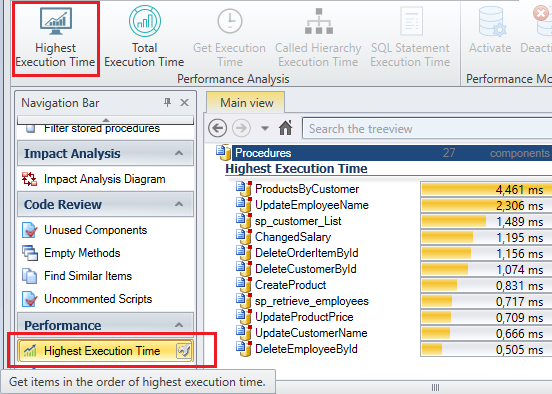
Highest Execution Time:
Goal : identify the slowest procedures, functions or triggers executed.
- Select the root of the procedures, functions or triggers
- Click "Highest execution time", from the ribbon or the navigation bar
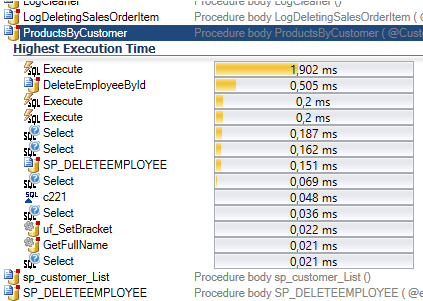
- The slowest procedures are listed, based on their average execution time.
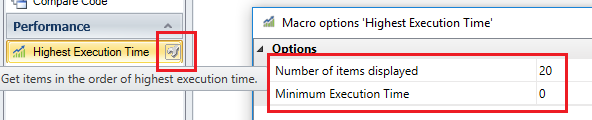
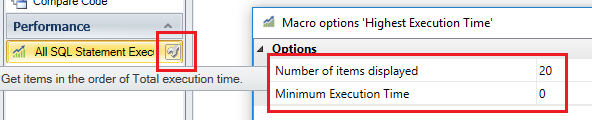
This feature comes with 2 parameters to let you customize it (click the small wrench on the right to set them):
- Number of procedures displayed in the result (20 by default)
- Minimum execution time, to show only procedures with a significant response time
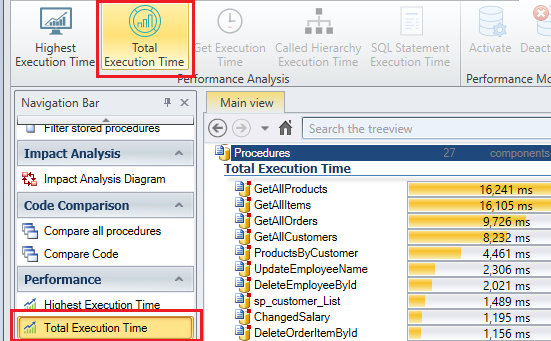
Total Execution Time:
The previous feature (Highest Execution Time) lets you identify the slowest functions, but a slow response time is not necessarily critical if the corresponding functions are rarely used.
To properly assess the criticality of this problem, you must take into account how frequently each function is actually executed:
The feature "Total Execution Time" calculates the total execution time for each procedure, function or trigger, by calculating the Average execution time x Number of times it is executed.
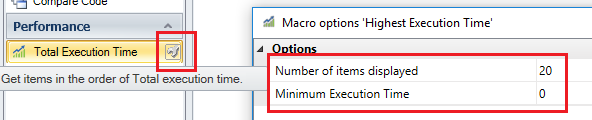
This feature comes with 2 parameters to let you customize the result (click the small wrench on the right to set them):
- Number of functions displayed in the result (20 by default)
- Minimum execution time, to view only functions with a significant response time
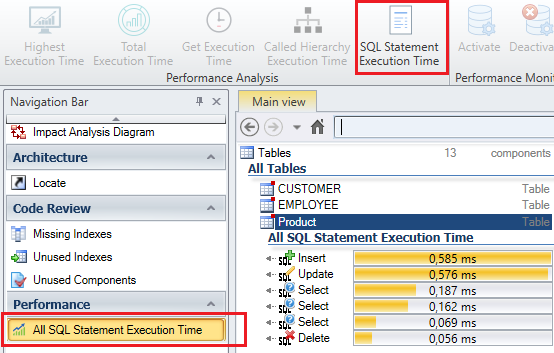
Optimize data access time
You can review the queries accessing a table to identify performance issues:
- Double-click on the root of the tables to list them
- Select a table (or several tables while pressing the key [Ctrl])
- Click "SQL Statement Execution Time", from the ribbon or the navigation bar
- The slowest queries are listed, based on their average execution time.
This feature comes with 2 parameters to let you customize it (click the small wrench on the right to set them):
- Number of functions displayed in the result (20 by default)
- Minimum execution time, to view only functions with a significant response time
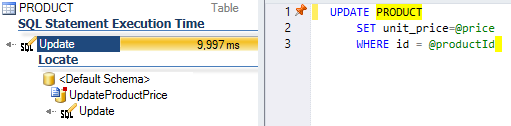
Once you identified a slow query, you can find the procedure that generated it, and review its source code:
- Select the query with a slow response time
- Click "Locate" in the navigation bar
- The location and source code of the query is displayed.
- Select the procedure containing the query to show its code.
Analyze the performance of a given object
While navigating in your code, you can check the response time of an object with the feature "Get Execution Time":
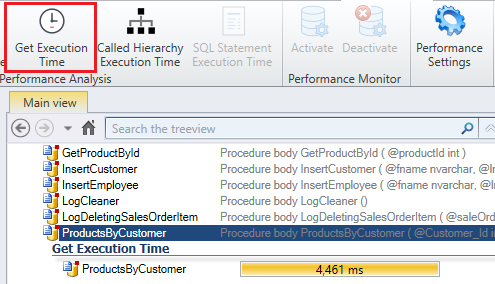
When you run into a slow object, you can break down its execution time to identify the instructions or queries causing the issue.
Simply select this object and click "Highest Execution Time" or "Total Execution Time":
Analyze the performance of a complete process
When users report a slow process in your application, you can investigate the entire chain of calls executed behind this process.
Called Hierarchy Execution Time
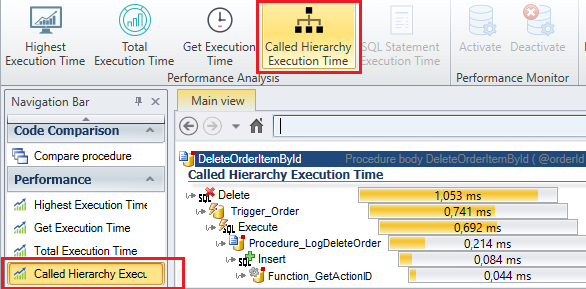
This feature generates a call tree, with all the objects executed along the application process, and analyze the performance of each object:
- Select the first object executed in the process
- Click "Called Hierarchy execution time", from the ribbon or the navigation bar
- The chain of call is displayed, with the response time of each object.
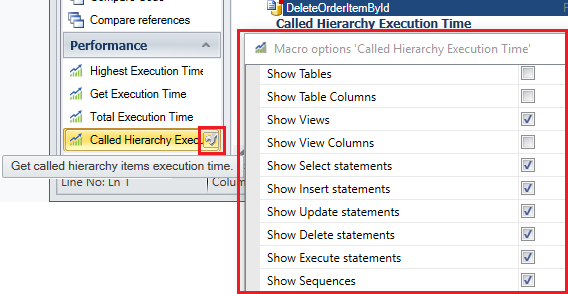
This feature comes with 2 parameters to let you customize it :
- Click the small wrench on the right to open the parameter:
- Select which type of objects will be displayed in the chain of calls
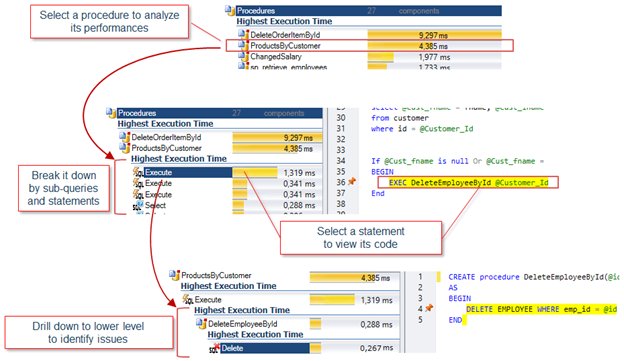
Drill down in your code, to identify performance issues
You can explore your code step by step, analyze the performances of each objects and go deeper to pinpoint key issues: