Explore, Analyze & Document your Code
Create Call Graphs with Visual Expert for PowerBuilder
WHY USE CALL GRAPHS?
A call graph is a diagram representing objects referencing each others (multiple levels).
This graph can be used to:
- Document the inner workings of an application, analyze every possible run.
- Predict the impact of a change
- Track the flow of values between procedures
- Detect anomalies of program execution, find procedures never called.
- Etc.
Example 1: Call tree between PowerBuilder methods
- In the treeview, select a PowerBuilder event or function.
- Go to [Diagrams] in the ribbon menu, and click on "Called Hierarchy diagram"
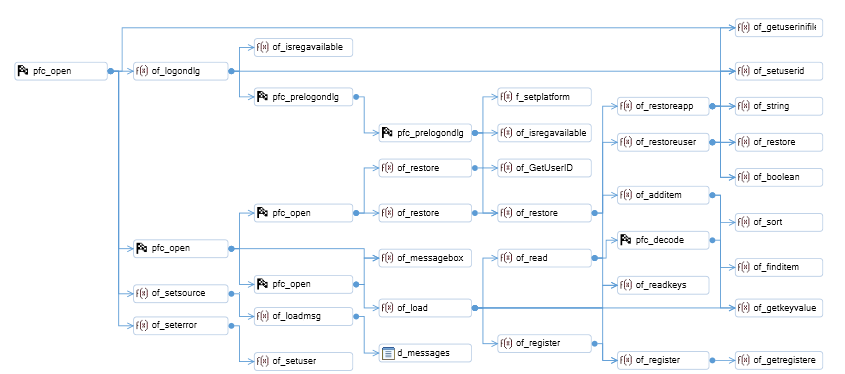
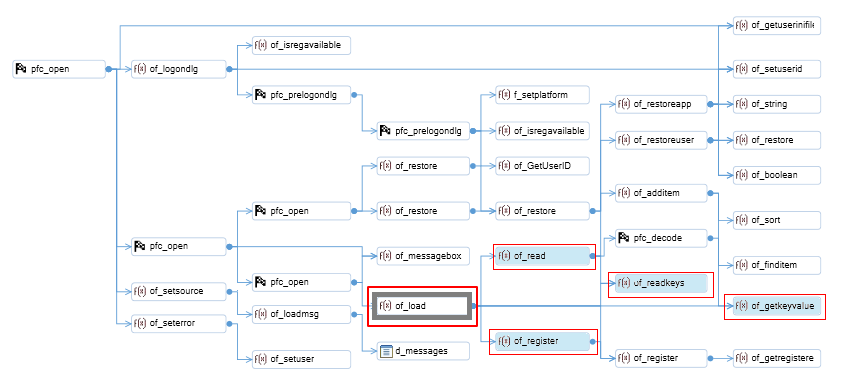
- You can highlight a particular script and its dependencies:
Select it in the diagram, and all the connected methods will be highlighted in blue
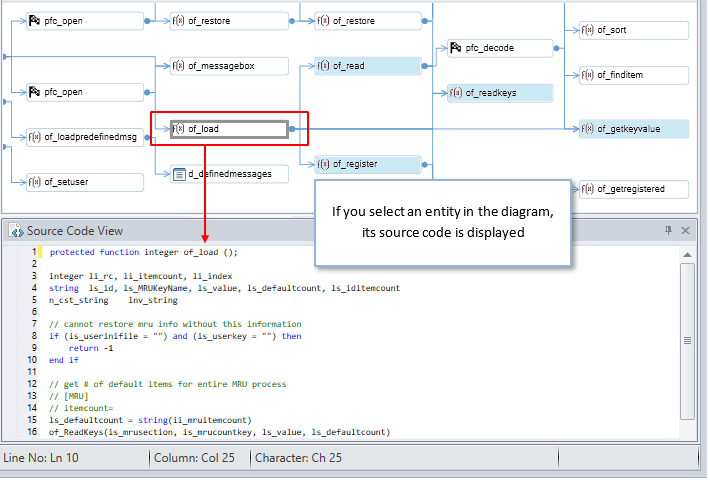
- If you select a script in the diagram, its code is displayed in the source code view:
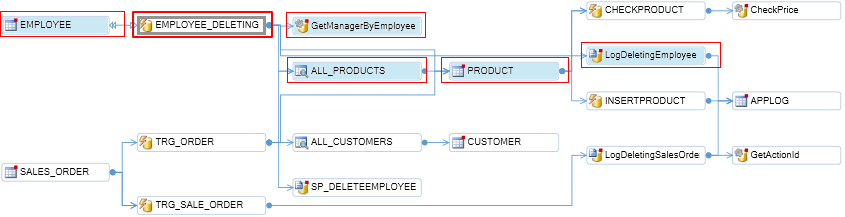
Example 2: Call tree between database objects
- In the treeview, select a stored procedure or a table, a function, a trigger, etc.
- Go to [Diagrams] in the ribbon menu, and click on "Called Hierarchy diagram"
- A diagram is generated. When hovering an item, a tooltip shows details about this item.
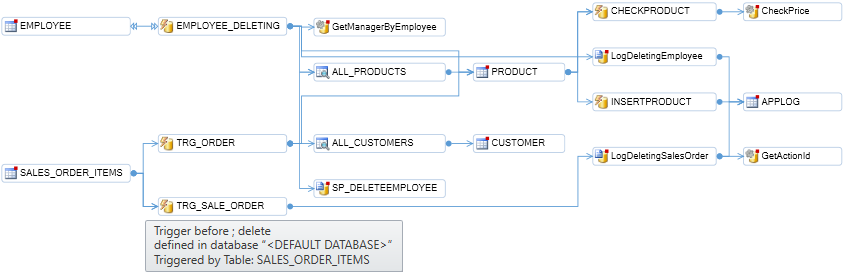
- You can highlight a particular entity and its dependencies: Select it in the diagram, all the connected items will be highlighted in blue
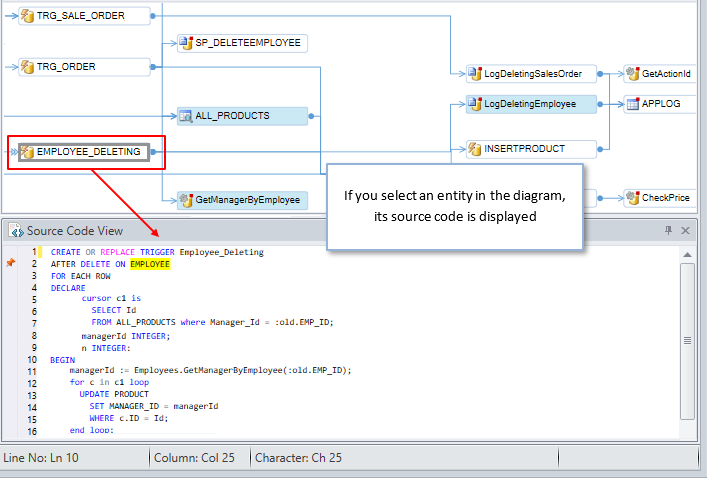
- If you select an entity in the diagram, its code is displayed in the source code view:
The Call Graph Diagram macro also includes a parameter to limit the number of items displayed.
If need be, users can change the default value in the [Options] window.
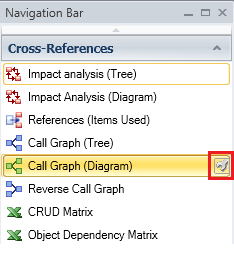
- Mouse over the Call Graph (Diagram) macro in the Navigation Bar and click on the
 icon.
icon.
- A new [Options] window will open on your screen.
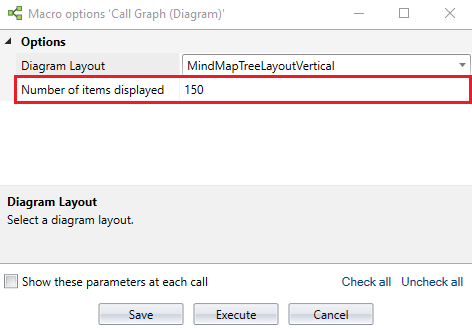
- Set the "Number of items displayed" to any value below 300.
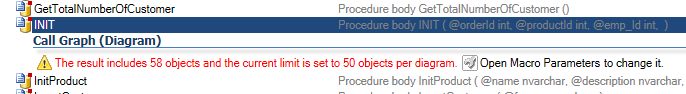
By default, this value will be set to 150. - In case, the resultant items for Call Graph (Diagram) feature exceed the set value by user,
Visual Expert will display an error message. See below:
Learn More