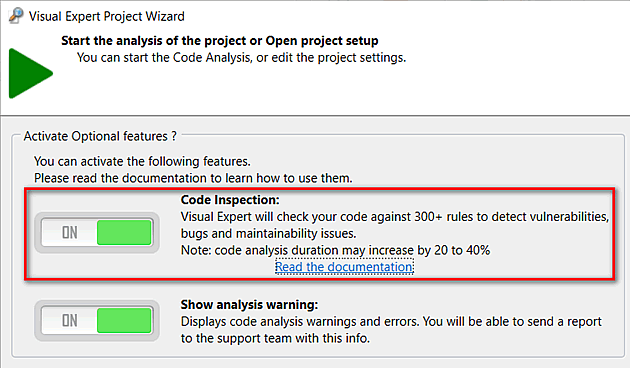
On activating Code Inspection, Visual Expert will analyze your code taking into account 300+ rules to detect vulnerabilities, bugs and maintainability issues.
Note: If you do not have configured Visual Expert yet, follow this tutorial to get started.
Enable Code Inspection while Creating a New Project
- Create a new project as indicated here: PowerBuilder, Oracle, SQL Server
After selecting the source code to be analyzed in VE Project Wizard, activate Code Inspection features:
Enable Code Inspection for an Existing Project
- For your existing project, enable "Code Inspection" feature via "Settings > More Settings"

- In the Code Inspection tab, activate code inspection features switching the "ON/OFF" button
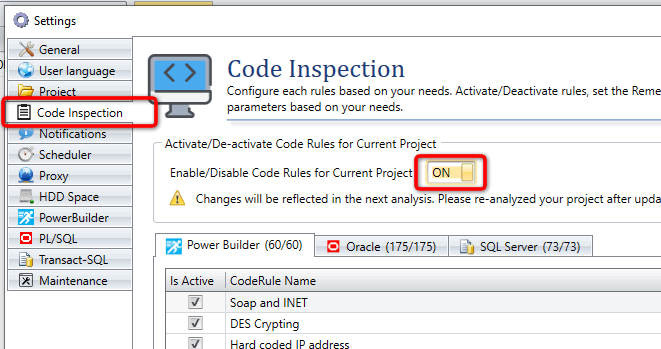
- You can review the code rules listed in the "Code Rule Name" column, and disable those you are not interested in by unchecking the "IsActive" box.
- Close this window to save your preferences
Code Inspection Result
Using Visual Expert, users can explore the code inspection analytics through:
- Code Inspection Dashboard
- Code Inspection Macro
1. Code Inspection Dashboard
Users can drill down into the code inspection results displayed on the dashboard. For instance, they can click on a high-level indicator to:
- View the complete list of bugs, vulnerabilities and maintainability issues corresponding to the clicked segment.
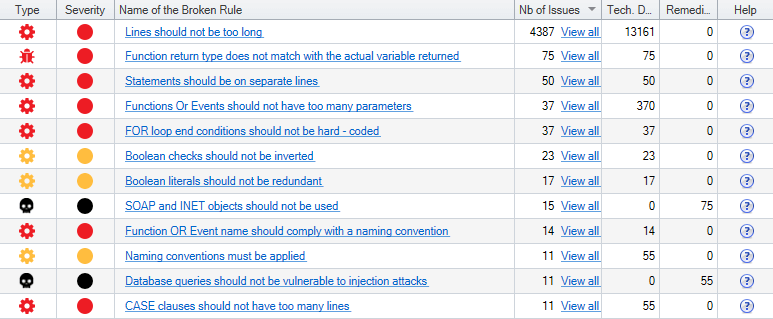
- Get direct access to code that needs to be fixed.
- Follow the evolution of the code quality and security.
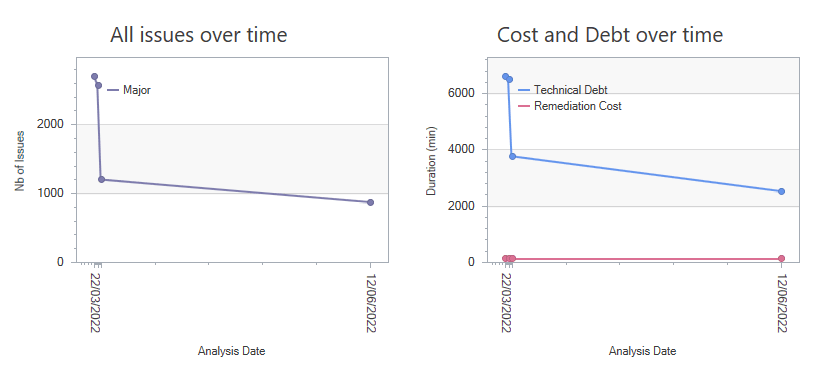
2. Code Inspection Macro
- When the Code Analysis is completed, a new section 'Code Inspection' is displayed in the Visual Expert treeview.
The languages supported are listed at the root of the treeview.
For each language, the number of rules available is indicated:
Select a language, for instance: 'Code Inspection for SqlServer'.

- Choose a macro to select the issues you’re interested in:
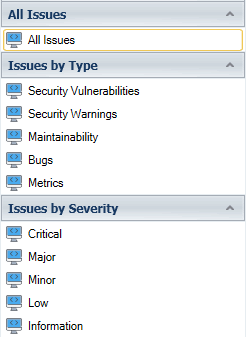
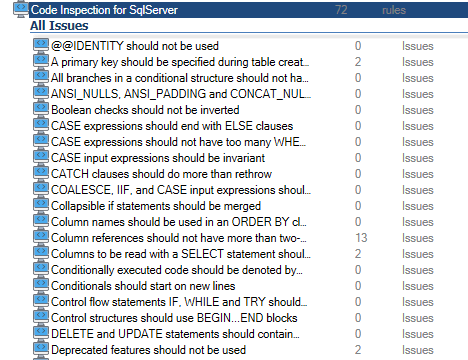
- The corresponding rules are listed in the treeview.
For each rule, the number of issues found is indicated as shown below.
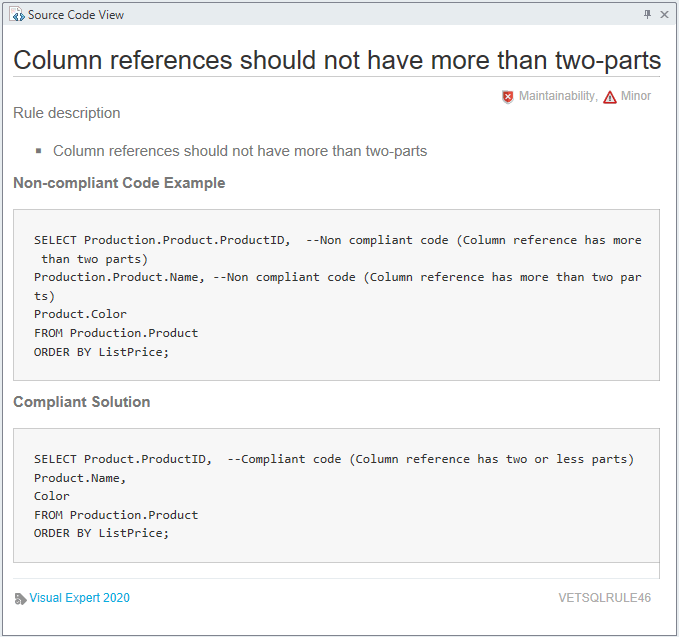
- On selecting a rule: a documentation page appears with details.
- In the navigation bar, click on 'Issues found':
Each object with this particular issue is listed in a container hierarchy.
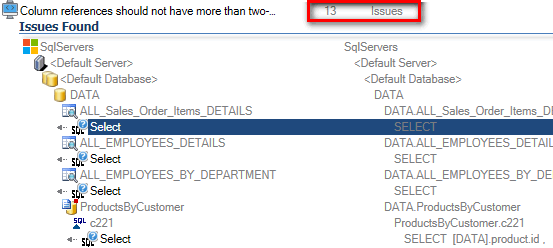
- On selecting an object from this list: Issues are highlighted in the code
