Visual Expert offers Graph Tooltips to guide the developers through their code inspection journey.
The Code Inspection Dashboard consists of :
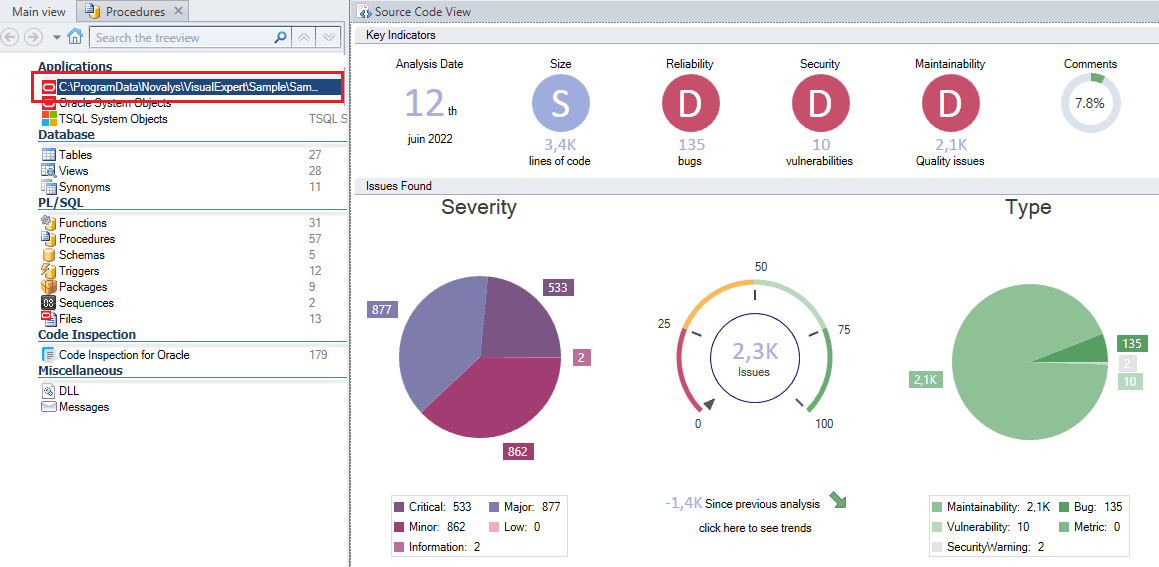
- Technical data, on the number and severity of bugs, security flaws and quality issues found in your code.
- Commercial data giving an estimation of remediation cost and technical debt to maintain code quality.
- Once Visual Expert has analyzed your project, click on your application in the [Main View].
The Code Inspection Dashboard will pop up in the [Source Code View].
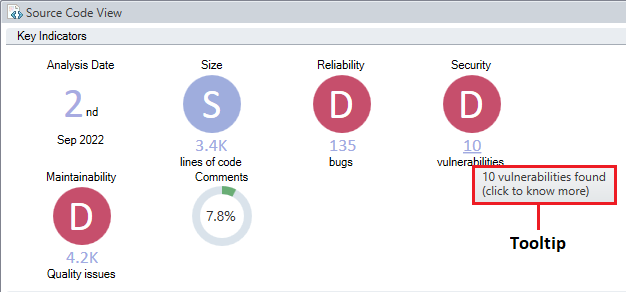
- When you mouse over any chart or metric on the dashboard, a graph tooltip appears with an invitation to click for more information.
Example 1
When you hover your mouse on the Security segment,
you will see a tooltip showing the number of vulnerabilities found.
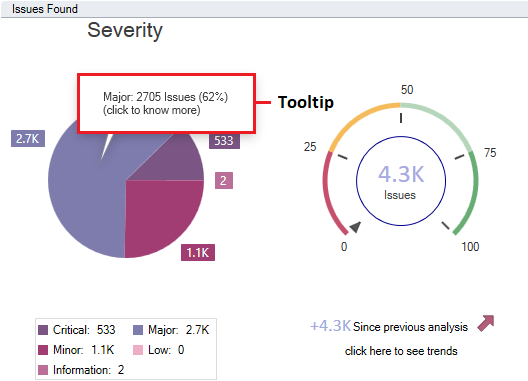
Example 2
When you hover your mouse on the Severity pie-chart, you will see a tooltip showing the number of major issues found as shown below:
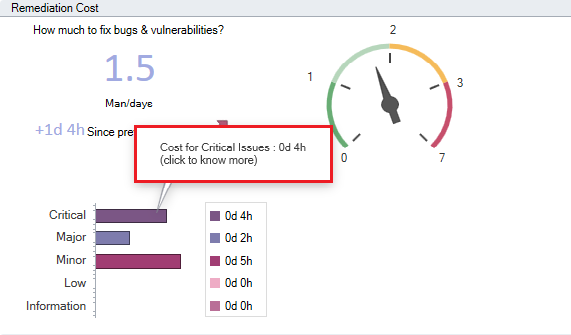
Example 3
When you hover your mouse on the Remediation Cost bar chart, you will see a tooltip showing the cost in terms of man hours to fix the critical issues.
More from Visual Expert Code Inspection
- Code Inspection Dashboard - Drill Down
- What to expect from VE Code Inspection?
- Key Concepts of Code Inspection