Explore, Analyze & Document your Code
Optimize the performance of a given object in your database
While navigating in your code, you can check the response time of an object with the feature [Average Execution Time] using Visual Expert.
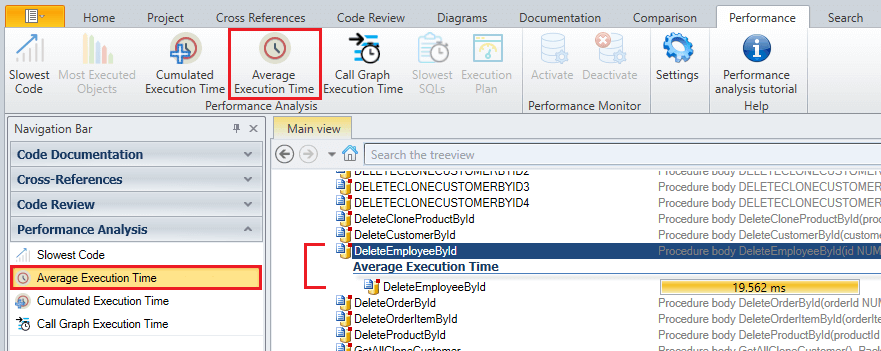
When you run into a slow object, you can break down its execution time to identify the instructions or queries causing the issue.
Simply select this object and click on [Slowest Code] or [Cumulated Execution Time].
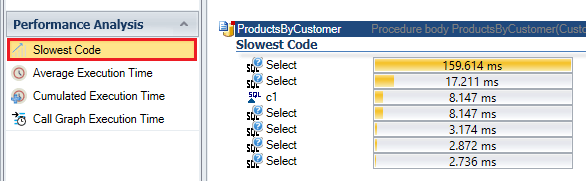
Result for Slowest Code
The Slowest Code macro enlists the slowest objects in your application regardless of the number of times they are being executed.
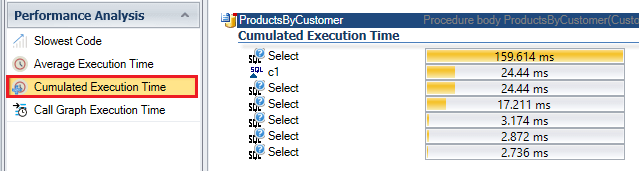
Result for Cumulated Execution Time
This macro enlists the objects taking most of the users’ time, degrading your application user experience.
Measurement Formula: [Average Execution Time * Number of Executions]