PowerBuilder applications accumulate vulnerabilities over years of maintenance: hardcoded credentials, deprecated components, unhandled errors.
Without systematic scanning, these issues often go undetected. Visual Expert analyzes your code against 300+ predefined rules to surface security vulnerabilities, bugs, and maintainability issues, whether they're already in production or still in development.
Note: If you have not yet configured Visual Expert, follow this tutorial to get started.
What kinds of PowerBuilder vulnerabilities does code inspection detect?
Visual Expert's PowerBuilder code inspection identifies three categories of issues that affect the security and stability of your PowerBuilder applications:
- Security vulnerabilities - hardcoded credentials and encryption keys, SQL injection risks, path traversal flaws, insecure encryption modes, deprecated components (SOAP/INET objects, OLE web browser, EAServer), and weak cryptographic algorithms (DES, MD5, SHA-1).
- Bugs and exceptions - empty catch blocks, unhandled errors, and logic paths that could be exploited or cause instability in production.
- Attack surface reduction - dead code, duplicate code, and obsolete components that increase the footprint of your application unnecessarily.
For the full list of PowerBuilder security rules Visual Expert enforces, see PowerBuilder Code Security Scanning Rules.
For teams approaching this as part of a wider security effort, the guide to securing PowerBuilder applications sets code analysis within a full security roadmap covering deployment, access control, and compliance.
Enable Code Inspection while Creating a New Project
- Create a new project as indicated here for: PowerBuilder, Oracle, SQL Server
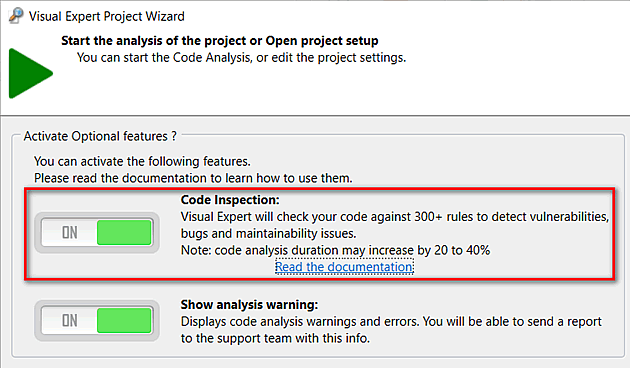
After selecting the source code to be analyzed in VE Project Wizard, activate Code Inspection features:
Enable Code Inspection for an Existing Project
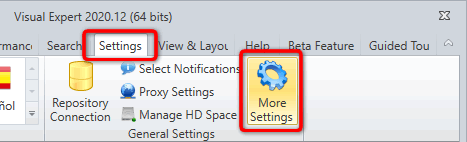
- For your existing project, enable "Code Inspection" feature via “Settings > More Settings”
- In the Code Inspection tab, activate code inspection features switching the “ON/OFF” button
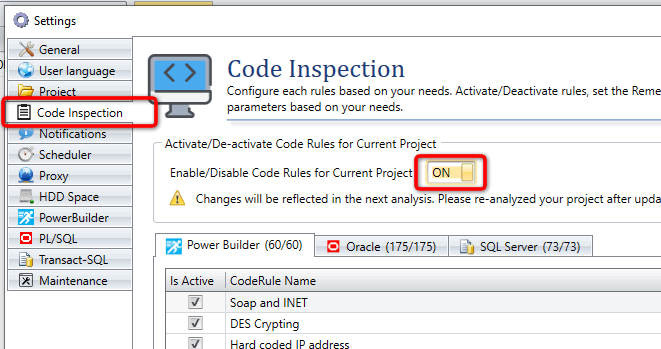
- You can review the code rules listed in the "Code Rule Name" column, and disable those you are not interested in by unchecking the "IsActive" box.
- Close this window to save your preferences
Code Inspection Results
Once the PowerBuilder code analysis is complete, Visual Expert gives you two ways to explore results.
1. Code Inspection Dashboard
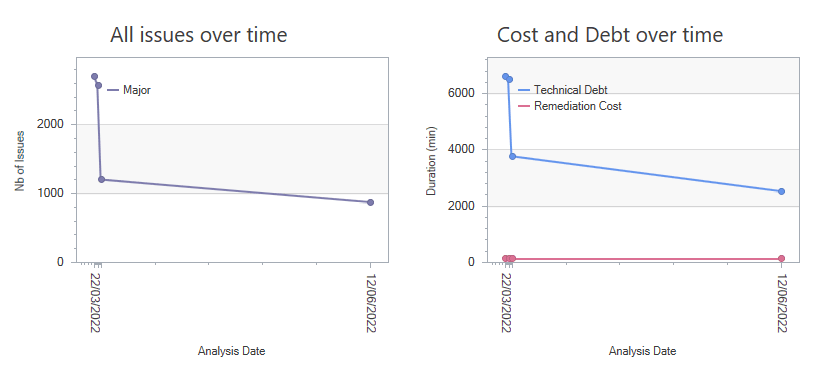
The dashboard gives you a complete PowerBuilder code analysis overview, broken down by severity and category.
For instance, they can click on a high-level indicator to:
- View the complete list of bugs, security vulnerabilities and maintainability issues corresponding to the clicked segment.
- Get direct access to code that needs to be fixed.
- Follow the evolution of the code quality and security.
2. Code Inspection Macro
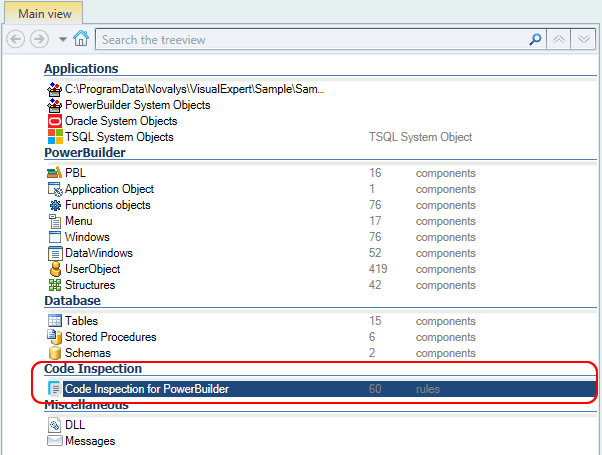
- When the Code Analysis is completed, a new section 'Code Inspection' is displayed in the Visual Expert treeview.
The languages supported are listed at the root of the treeview.
For each language, the number of rules available is indicated:
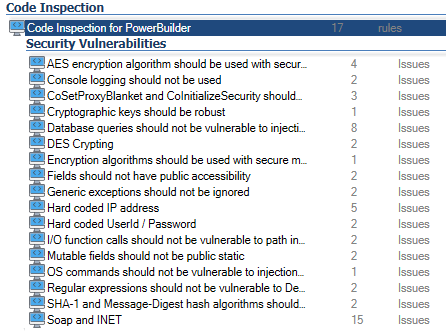
Select a language, for instance: 'Code Inspection for PowerBuilder'.
- Choose a macro to select the issues you’re interested in:
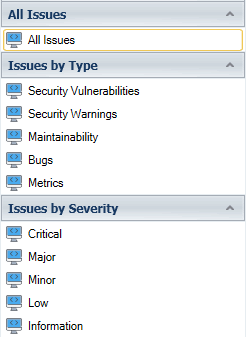
- The corresponding rules are listed in the treeview.
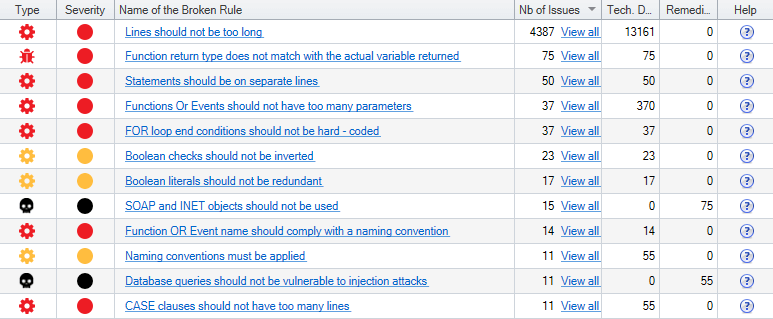
For each rule, the number of issues found is indicated as shown below.
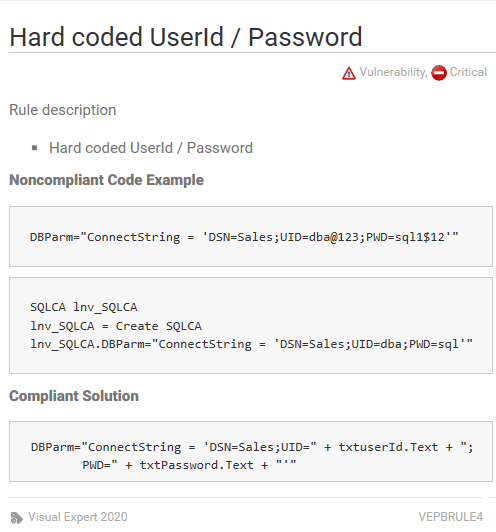
- On selecting a rule: a documentation page appears with details.
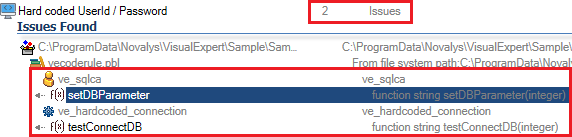
- In the navigation bar, click on 'Issues found':
Each object with this particular issue is listed in a container hierarchy.
- On selecting an object from this list: Issues are highlighted in the code
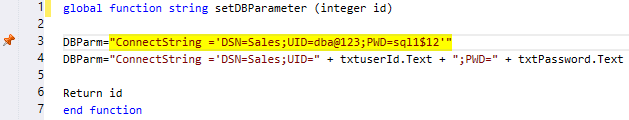
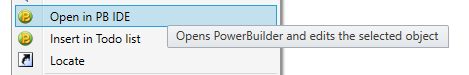
- You can then open this script directly in the PB IDE to fix the issue.