Explore, Analyze & Document your Code
Optimize Slow SQL Queries
DBA tools can identify slow queries affecting DB response times. But this information is often useless for developers, as they usually cannot locate the origin of such a query in their code. In such cases, poor performing SQLs remain unchanged in the code.
By combining SQL execution statistics with a static analysis of the code, Visual Expert can go further and pinpoint the procedures or functions where the SQL should be improved.
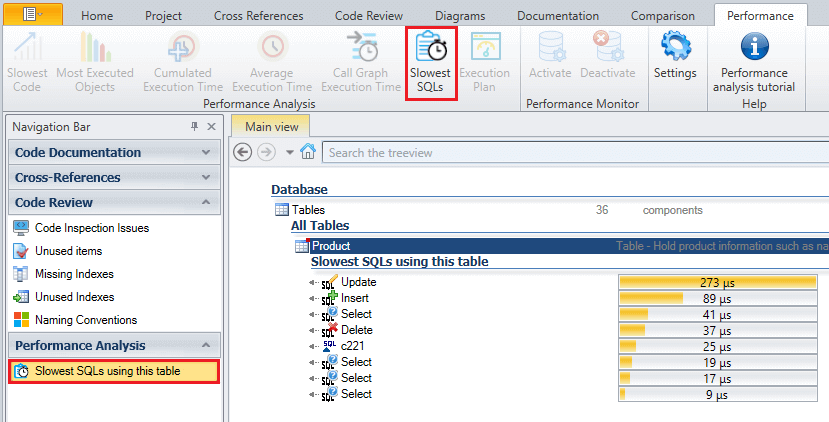
You can review the queries accessing a table to identify performance issues:
- Double-click on the root of the tables to list them
- Select a table (or several tables while pressing the key [Ctrl])
- Click on [Slowest SQLs using this table] from the ribbon or the navigation bar.
- The slowest queries are listed, based on their average execution time.
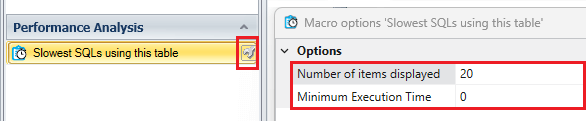
This feature comes with 2 parameters to let you customize it (click the small wrench on the right to set them):
- Number of functions displayed in the result (20 by default)
- Minimum execution time, to view only functions with a significant response time
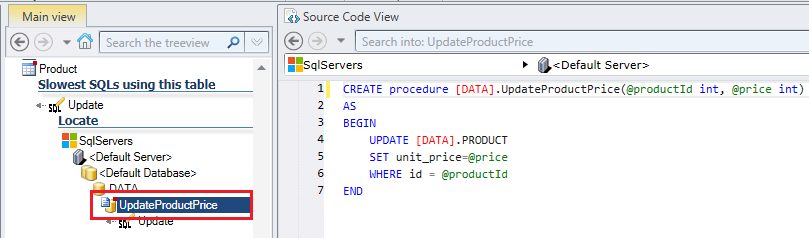
Once you identified a slow query, you can find the procedure that generated it, and review its source code:
- Select the query with a slow response time
- Click on [Locate] in the navigation bar under Code Documentation.
The location and source code of the query is displayed.
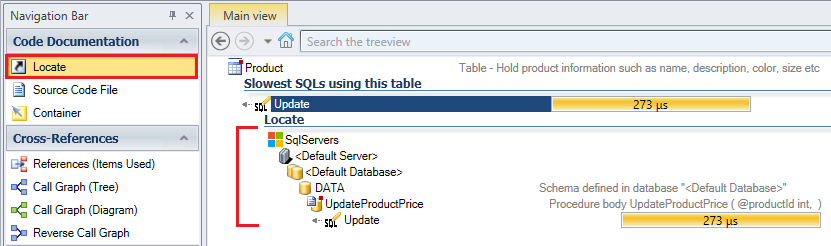
- Select the procedure containing the query to show its code.