Explore, Analyze & Document your Code
Analyze the performance of a complete process
When users report a slow process in your application, you can investigate the entire chain of calls executed behind this process.
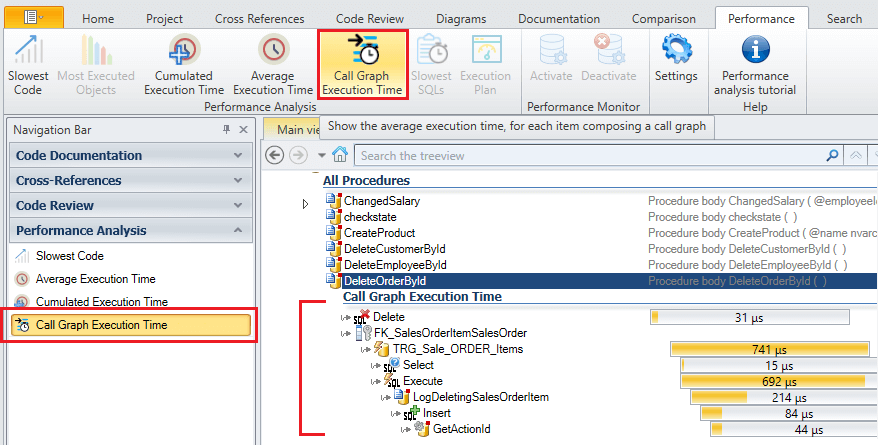
Called Graph Execution Time
This feature generates a call tree, with all the objects executed along the application process, and analyzes the performance of each object:
- Select the first object executed in the process
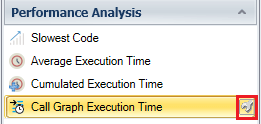
- Click on [Call Graph Execution Time] from the ribbon or the navigation bar
- The chain of calls is displayed with the response time of each object.
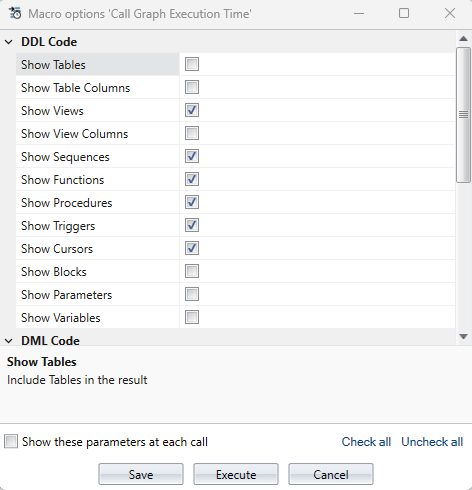
This feature comes with 2 parameters to let you customize it :
- Click the small wrench on the right to open the parameter:
- Select which type of objects will be displayed in the chain of calls
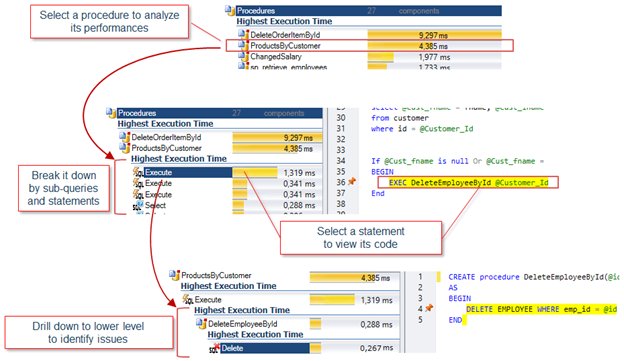
Drill down in your code, to identify performance issues
You can explore your code step by step, analyze the performances of each object and go deeper to pinpoint key issues: