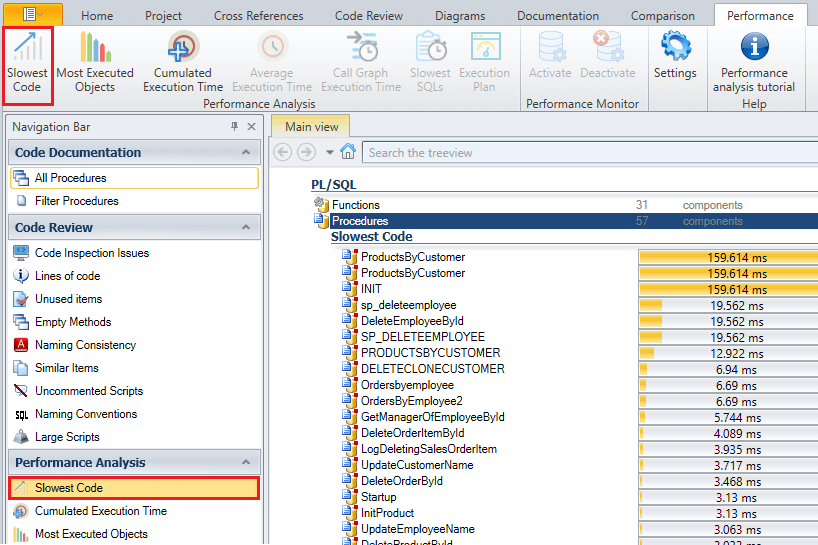
Identify the Slowest Pieces of Code in your Database
Slowest Code
Identify the slowest procedures, functions, or triggers executed.
- Select the root of the procedures, functions or triggers
- Click on [Slowest Code] from the ribbon or the navigation bar under Performance Analysis.
- The slowest procedures are listed, based on their average execution time.
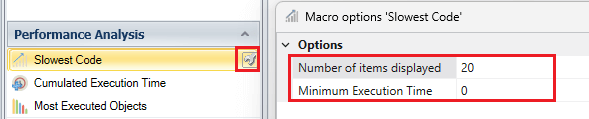
This feature comes with two parameters to let you customize it (click the small wrench on the right to set them):
- Number of procedures displayed in the result (20 by default)
- Minimum execution time, to show only procedures with a significant response time
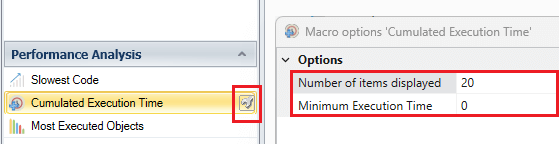
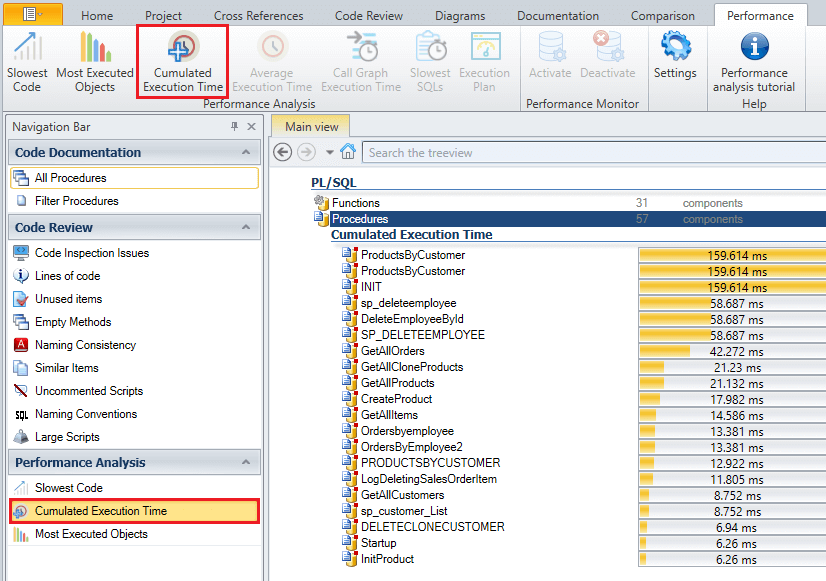
Cumulated Execution Time
Calculate the Cumulated Execution Time for each procedure, function or trigger,
by calculating the Average execution time x Number of times it is executed.
The Slowest Code feature lets you identify the slowest functions with the highest execution time, but a slow response time is not necessarily critical if the corresponding functions are rarely used.
Actually, to properly assess the criticality of this problem, you must consider how frequently each function is actually executed.
This feature comes with two parameters to let you customize the result (click the small wrench on the right to set them):
- Number of functions displayed in the result (20 by default)
- Minimum execution time, to view only functions with a significant response time