Press Release
Visual Expert - Comprehensive Application Documentation and Impact Analysis
About the Author
William (Bill) Green is a well-known and sought after speaker at
many user conferences and seminars. Bill is co-author of PowerBuilder
5.0: Object-Oriented Design & Development, PFC Professional
Reference. Bill was also a contributing author to the PowerBuilder
4.0 Developers Guide, and a co-author of Secrets of the PowerBuilder
Masters 4 & 5.
Bill has written for several OO magazines.
This Product Review was written for the PowerBuilder Developer
Journal
Introduction
Ever worked on an application you didn’t write? Ever worked
on an application you wrote more than 3 months ago? Chances are
most of us have, and we all face the same issues when looking to
make a modification to the code. What is this application doing?
What objects are affected if I make changes to this object? We’re
talking about Impact Analysis of course, something we often don’t
do because it’s simply too much work to do it. Performing
a thorough impact analysis on an object-oriented application would
take several times longer than the change being requested. Should
we do it? Of course. Any amount of time spent before physical changes
translates to lower risk of a problem appearing when the modified
application goes into production. If only there was a tool that
would do the time-consuming drudgework we all loathe so we can make
better decisions and get changes into production more quickly with
less risk. Now you can. Visual Expert, an analysis product from
Novalys, will perform impact analysis for you allowing you to see
within minutes what the impact of a change might be. Have to change
a DataWindow? A click on the analysis treeview will show you all
the objects the DataWindow is referenced in.
Visual Expert delivers powerful Impact Analysis capabilities, but
it also does something else we often want to do – produce
technical documentation on our system. The documentation capabilities
are thorough, producing good-looking documents in either RTF or
HTML format. This is very useful in getting new developers to understand
the system, however, it’s of less importance to me personally
as technical documents need to be constantly updated to provide
any measurable benefit. Of course, if you are a third party developing
for a client, then the added benefit is that of delivering comprehensive
– and accurate – technical documentation of the system.
As a side benefit, Visual Expert will also perform some rules checking
on the application code. It is not touted as a code quality auditing
tool, but it does provide some rudimentary rules checking capabilities
so you can quickly see whether objects meet naming convention standards,
whether references in objects are being used etc.
Strengths
Visual Expert reads the objects in the PBL’s containing the application source code. In PB7 and prior, the objects are determined by the library list for the application. In PB8, that list comes from the Target specified. The product is very capable of analyzing a large application very quickly. My example application I tested with is spread out over 62 PBL’s, and contains a lot of inter-referenced code. I was able to easily navigate between the various views to determine what impact there would be on any object in my application. The main view is split over various categories making it easier to pinpoint the starting point for the analysis, and the processing was very fast and painless.
Impact Analysis
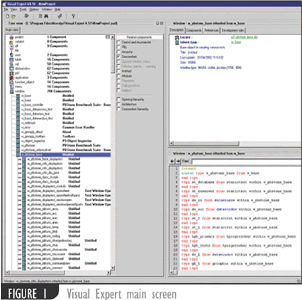
As shown in Figure 1, the main display is divided into three distinct
areas. The navigation treeview, a main detail display and a secondary
detail display that will show the actual code if needed. On the
main treeview, a collection of top level items give you a route
to take, and developers will quickly find the navigation intuitive
and quite flexible. You can position on the Window group for example
and see all of the windows in the application. Right Mouse Button
options - a core of which reference related components, the sidebar
to the right of the treeview – give you quick access to impact
analysis type information about the object in question.
The RMB typically also offers a preview option which you can use
to preview the object (and see what it would look like), and/or
a locate option, which will quickly show you which PBL the object
is stored in. The display also very quickly indicates where duplicates
might exist.
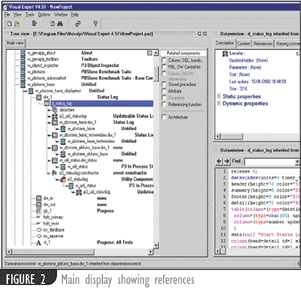
A quick click on any of the Impact Analysis options (shown in the
display as Referenced Components) gives you an instant insight into
the object. You can see it’s ancestry, any descendants, peek
into the architecture of the object, and as each option is selected,
the treeview expands with additional entries, each of which have
an additional set of options.
Looking at figure 2, you can see how I’ve expanded on one
of my base objects (w_pbstone_base), and you can see what windows
are inherited from it. Then I selected on of the descendants (w_pbstone_base_displaytest)
and can see what methods or on it, as well as the objects architecture
(what controls are found within).
By selecting the DataWindow control, DW_1, I can further drill down
to see that it has a DataWindow control d_status_log assigned to
it. I can then see what other DataWindow controls in my application
use this DataWindow, determine what windows those DataWindows are
in, and what PBL’s the windows are located in. I can thereby
determine what impact any change to the d_status_log DataWindow
might have.
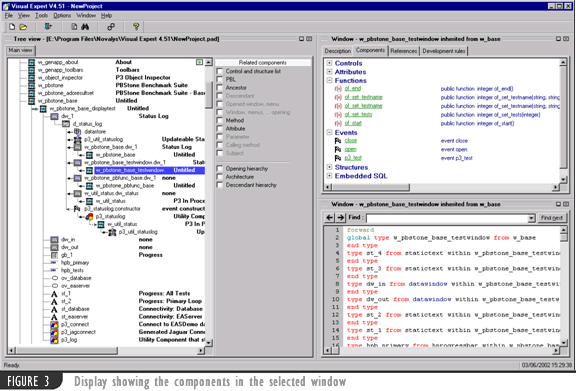
Continuing the tracking trend, you can position on any object and in the main detail view in the top-right, you can see all of the attributes associated with an object. The example in Figure 3 shows the attributes of a selected window, with tab pages to see the description, components (shown), references and development rules. These tabs give you a variety of useful information about the object in question.
When an item in the main detail is selected, the secondary detail window will change to show the details based on the selection, for example, selecting a function will display the code for that function. This is shown in figure 4 where I have selected the of_set_testname function.
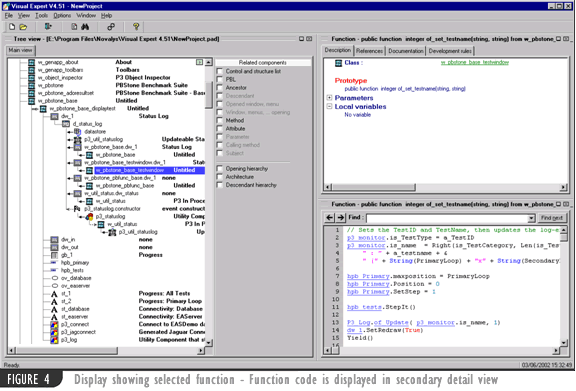
All functions and objects are hyperlinked within the code view
window and can be used to position to the referenced item, so where
you see a reference to an external object, such as in this case,
p3_monitor. Selecting this will change the display to that object
and therefore allow further impact analysis to take place.
The last tab in the main detail view is development rules. Development
rules include verifying naming conventions, determining variables
that are unused, detecting scripts with no comments, etc. There
is an optional component for Visual Expert that will allow you to
capture more specific rules for your specific needs.
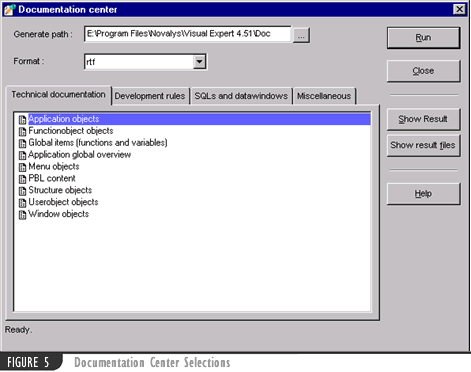
Documentation
Finally, we’ll talk about the documentation capabilities. Choosing the menu option “Documentation Center” brings you to a dialog window to select the documentation options. Figure 5 shows this dialog. You can set the parameters for the documentation required and pressing run creates the documentation.
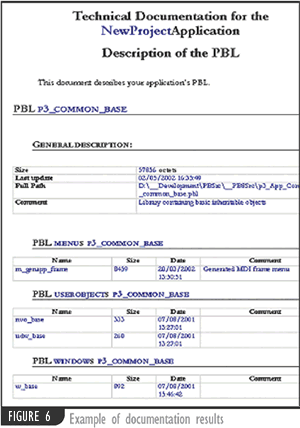
After making your selections and running the process, the output
is generated in either .RTF or .HTML format. An example of the output
is shown in figure 6.
All in all, the tool is packed with features allowing you to perform
very detailed analysis of the application and it’s objects.
The layout is generally very use to use and get used to, although
it will take a short period of time to get used to what kinds of
data you can get to.
Weaknesses
Having used other analysis tools in the past, I was
pleasantly surprised to find that this tool comes up with few weaknesses.
One very obvious one is that the vendor, Novalys, is located in
France, and every now and then, it becomes apparent that the language
translation has not been an easy one. These types of nuances are
easy to overlook however, when viewing the product as a whole.
Again, because the vendor is located in France, there is currently
no local support. The product is fairly new though, and I expect
that this will change as demand grows for it.
As with any script-parsing tool, the product is subject to the inventive
whims of programmers. References comprised of string concatenations
will not be made, for example, “d_” + “Status_log”
or is_mydwname being used to set up a dynamic datastore, cannot
be found. Regular string expressions, however, are detected, for
example, is_myDWName=”d_status_log”.
The online help needs some work, Apart from not being detailed enough,
many of the images used are out-of-focus, detracting from an obviously
professional product.
An installation key that you have to obtain from the vendor controls
installation. Taking into account the timezone difference between
the U.S. and France, it may take 24 hours to obtain the keycode
needed to unlock the product. I expect that this will also change
as further support structures are put in place.
Conclusion
Given our propensity as developers to avoid any task that takes too much time to perform, avoid documentation at almost any cost, and make changes to applications relying on our testing practices to determine the impact, it’s my opinion that this tool would go a long way to making many of our lives easier, and our jobs less risky. It will help to reduce the risk of change to any application, and provides a mechanism to provide accurate and up-to-date documentation of our applications. The tool should be a must-have on any software consultant’s list, and can provide a significant benefit to any user of the product regardless of the developers experience level with PowerBuilder.