Production statistics mapped directly onto your code.
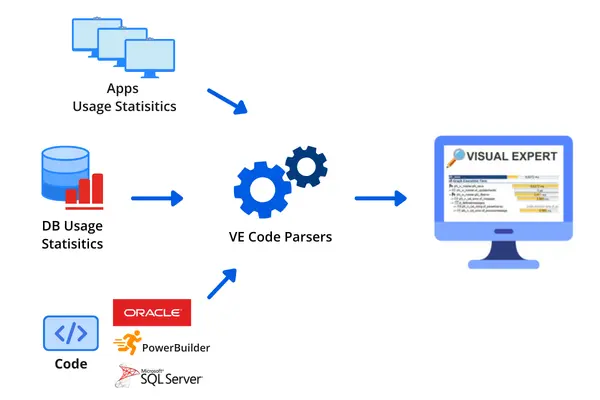
Visual Expert imports execution statistics collected from your database server or PowerBuilder application — then maps them directly onto your codebase. Every procedure, function, event, object, or SQL query is annotated with how long it actually takes to run in production.
The result: you open Visual Expert and immediately see what is slow, how slow it is, and exactly where in the code it lives.
Collect Execution Statistics
Visual Expert connects to your SQL Server or Oracle database and captures performance data. For PowerBuilder, a trace library records execution data from your running application.
Map Performance Data onto Your Code
Visual Expert combines the collected statistics with its static analysis of your codebase. Every object, method, function, and SQL query gets a performance profile — ranked by execution time and call frequency.
Drill Down to the Exact Line. Fix It.
Navigate from the slowest objects down to the precise line of code or query causing the problem. Fix it, re-analyze, and measure the improvement.
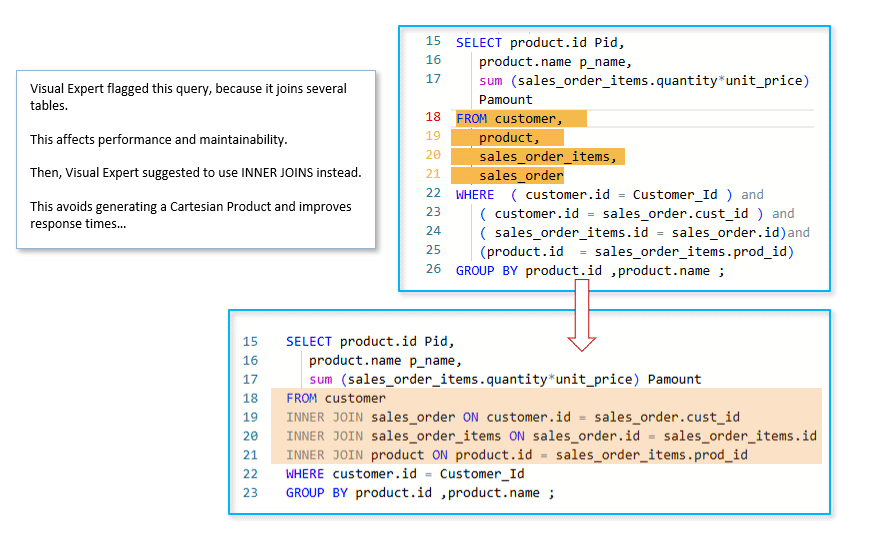
Every tool you need to find and fix slow code.
Visual Expert covers the full performance investigation workflow from high-level slowdown ranking
to line-level profiling and database optimization.
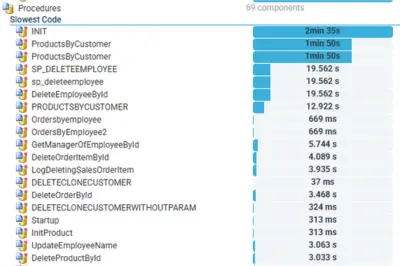
Slowest Code
Visual Expert helps you to troubleshoot performance issues by listing the slowest objects, methods, events, functions, procedures, etc.
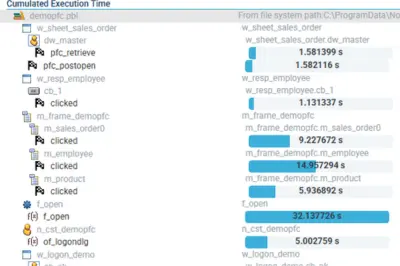
Cumulated Execution Time
From another angle, you can also find the objects with the highest cumulative execution time. Saving µs on frequently used features will make a big difference to your users
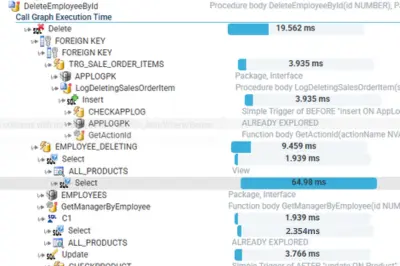
Call Graph Execution Time
Start your investigation under the angle of the application feature users complain about:
- Visual Expert displays the chain of calls executed behind a feature.
- It shows the average execution time of each item.
- You can then identify bottlenecks and improve the corresponding objects.
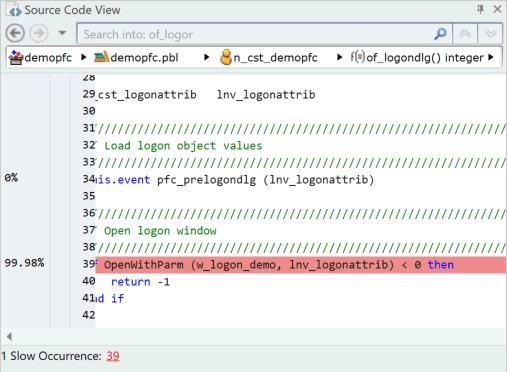
PowerBuilder Profiling New
Once a slow object has been identified, launch a profiling session for deeper analysis.
Visual Expert displays the functions and lines of code at the origin of performance problems.
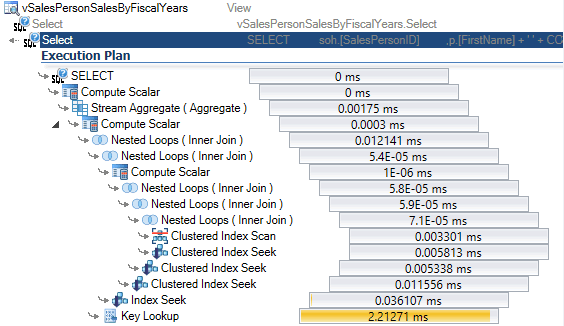
Get Query Execution Plan
Fetch a detailed view of the query execution process within your DB. No need to revisit your DB manager for the execution plan.
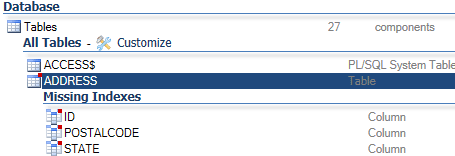
Add Missing Indexes
Indexes speed up SQL queries, but poor configuration can degrade performance. Their creation depends on SQL code, which changes as the application evolves. Visual Expert automates this task by analyzing database code and schemas, detecting missing indexes to optimize response times.
AI-Driven Optimization Suggestions
Visual Expert's AI analyzes your specific code context — your actual queries, your actual indexes, your actual application logic — and generates targeted fixes. Not generic advice. Real recommendations for your codebase.
Recommendations cover query rewrites, missing indexes, join optimization, and code-level improvements — with explanations of why each change matters and what performance gain to expect.