Visual Expert 2024 is available
Discover the New Features to Boost Productivity and Code Quality
Download Visual Expert
PowerBuilder Code Profiling
You have identified a slow feature using Visual Expert or as a result of user feedback.
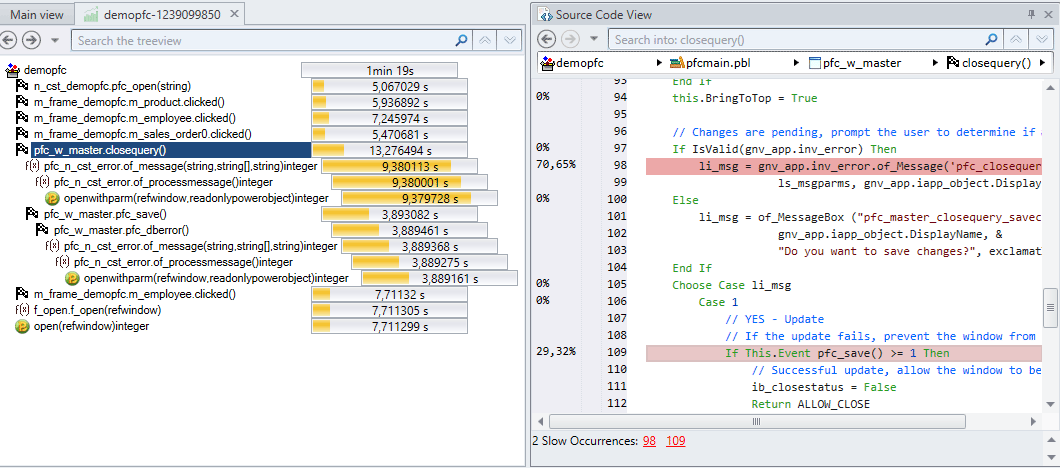
Generate a trace of your PowerBuilder code to identify at a glance the lines that consume the most time in your business process.
Visual Expert delivers relevant, readable results by displaying in the treeview only those elements that consume the most time in a process.
The most time-consuming code is highlighted in red in the source code view, along with the percentage of execution time for the line in question.
Visual Expert Web
VE Web is a web-based interface enabling remote access to Visual Expert's features for code analysis, report generation, and project management without needing the desktop application. It supports collaboration and account management from any location with internet access.
Key Advantages of the Visual Expert Web
- Accessibility
- Cross-Platform Compatibility
- Ease of Use
- Collaboration
- Centralized Management
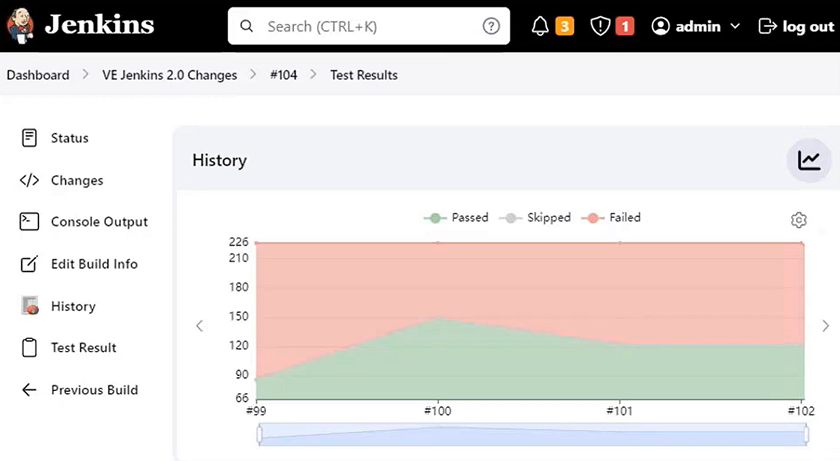
Code inspection reports in JUnit and JSON format
Export the result of Visual Expert code inspection and integrate them in your DevOps platform.
You get a complete overview of your project including code review output without opening Visual Expert.
Set Up Code Inspection Profiles
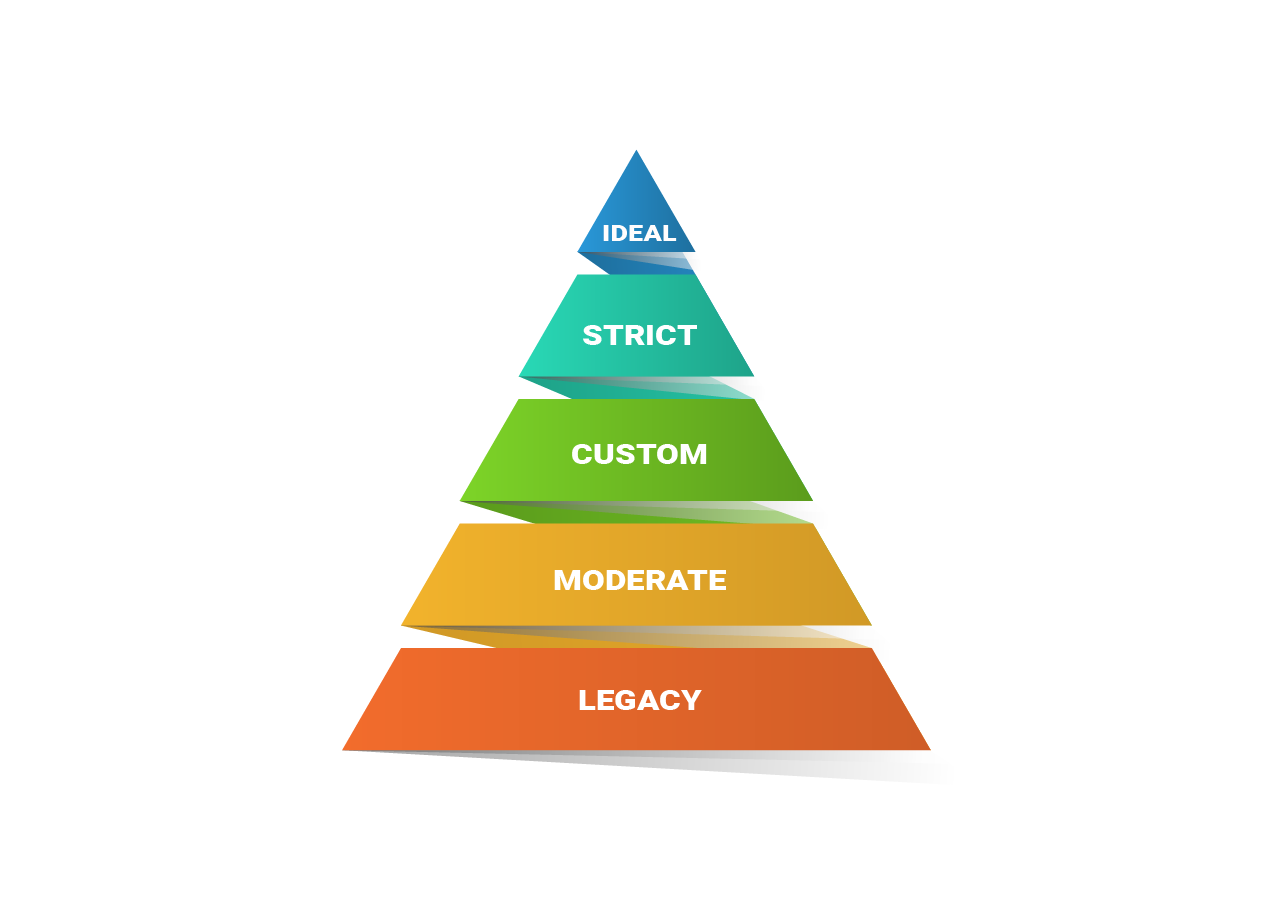
Define code inspection thresholds to customize code review results and ensure a balance between code quality and security, and practical considerations.
- Ideal: thorough and comprehensive
- Strict: very rigorous
- Moderate: balance between strictness and leniency
- Light: verifies only the most critical issues
- Legacy code: to start enhancing an older application
- Custom profile
Migration to PowerBuilder 2022 and Higher
Visual Expert integrates a set of specific rules to complement the information provided by the PB Migration Assistant.
Automatically identify code that is no longer supported in this milestone version of PowerBuilder.

Quick Search
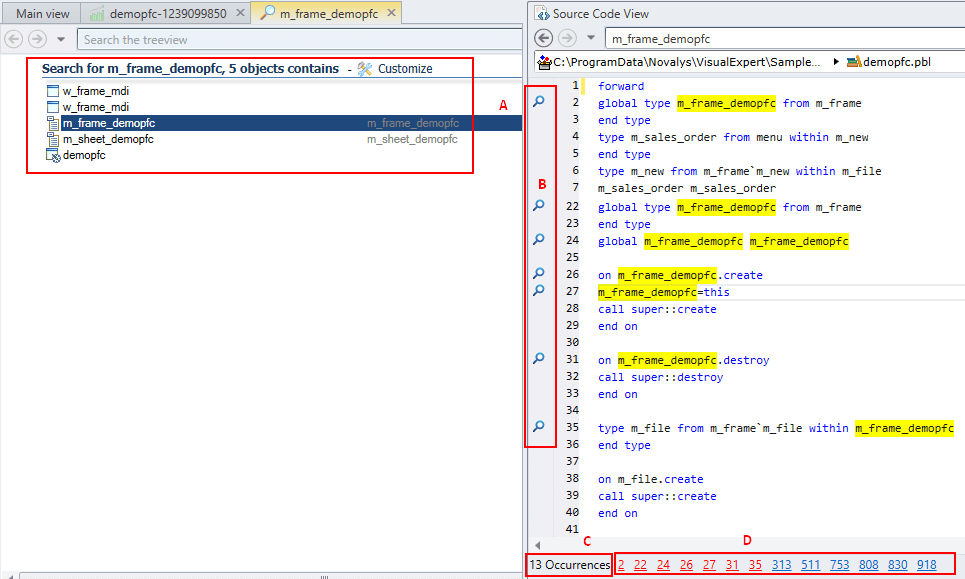
Visual Expert 2024 now features a Quick Search functionality that displays results in the form of a simple list in the treeview.
Easily locate and access the string you are looking for by using the various markers added to the source code view.
Performance and Speed Improvements
- Faster execution time for treeview macros
- Reduced duration of code analyses
Core features
- New licensing system based on lines of code.
- Ability to create projects using PowerBuilder targets in Source Control.
- Improved dialog boxes for connecting to Source Controls.
- Enhanced support for FIPS encryption for connections to both VE Repository and Projects.
Visual Expert Macro Development
- Enhanced CRUD matrix for DataWindows.
- Introduction of a new Macro for the performance-oriented Smart Profiling.
- Added 'Most Defective Items' macro for both the Application and Code Inspection root nodes.
Catch a glimpse of Visual Expert
Impact Analysis
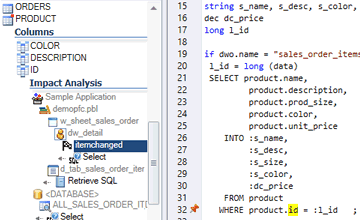
Assess the impact of a change in your code
Estimate what you should modify to accomplish a change.
Don't break your application after a change!
- If I change this variable, what is the effect on my code?
- If I add a parameter to a function, what else is affected?
- If a table or column is changed, which code should I update?
Scan for Security Vulnerabilities
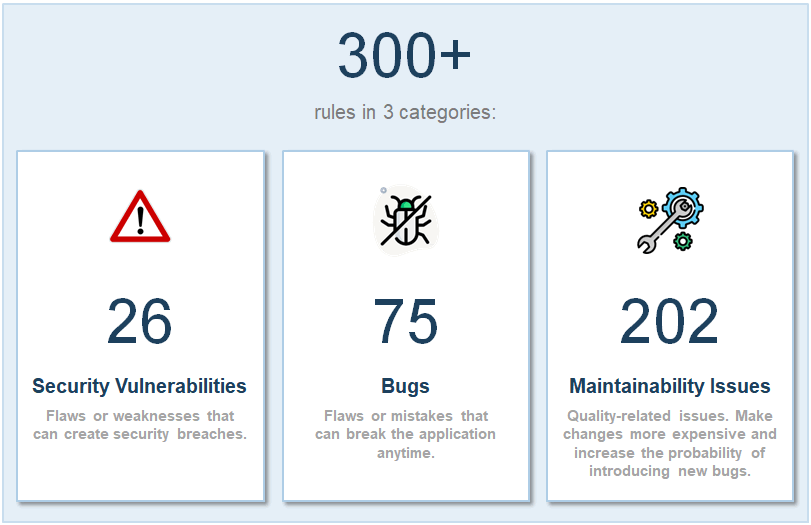
Identify and fix Security issues in your code:
- Hard coded user id & passwords
- Hard coded IP addresses.
- Vulnerabilities to Injections attacks
- Fields access/protection issues
- Improper/unsecured use of encryption
- and more...
Review CRUD Operations in Your code
(Create, Read, Update, Delete)
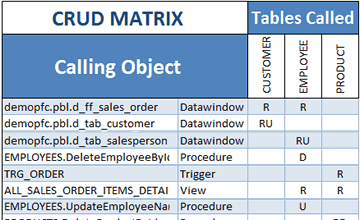
Generate a CRUD matrix showing which programs access your data.
For instance, which DW or Procedures Create/Read/Update/Delete which Tables.
- Review dependencies between database and PB applications.
- Analyze the impact of changing your database Schema, for example changing a table definition or adding an index.
- Estimate software complexity and development efforts.
- Find out which table is never updated, deleted from multiple places, etc.
- Make sure every process has at least one input (R) and one output (CUD).
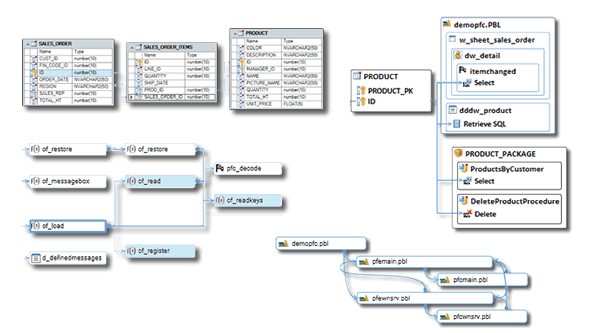
Generate Diagrams from your Code
- Visualize objects and dependencies.
- Diagrams and source code are synchronized.
- Select objects to generate a diagram
Visual Expert generates:
- Data Model Diagram to document graphically database entities and their relationships.
- Impact Analysis Diagrams to find all references to a table, column, object, method, variable...
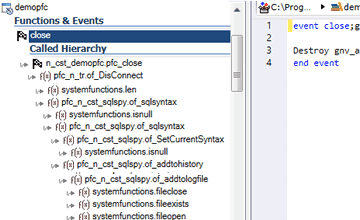
- Call graphs to visualize chains of calls (multiple levels of references).
- PBL dependency diagrams to visualize dependencies between PBLs
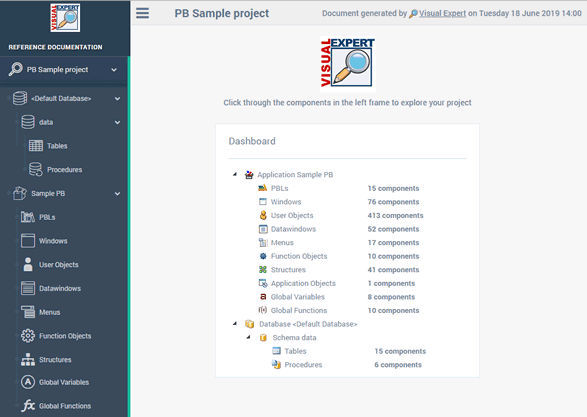
Document your Code
Create reference manuals in HTML
Update your documentation on a regular basis (scheduled job).
Document the references in your code and navigate between these using hyperlinks.
Share knowledge with teammates.
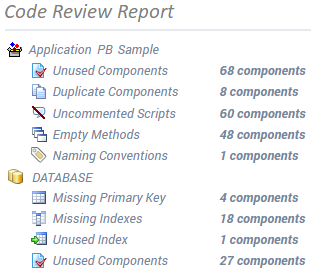
Improve Code Quality
Cleanup the code. Streamline maintenance efforts. Avoid unexpected behavior.
- Identify unused objects and remove some dead code.
- Find empty methods, duplicated objects, oversized or uncommented scripts.
- Calculate code metrics: lines of code, number of objects, methods, variables…
- Check naming conventions.
- Find objects that do not inherit from an ancestor etc.
- You can check your code against hundreds of rules
Improve Code Performance
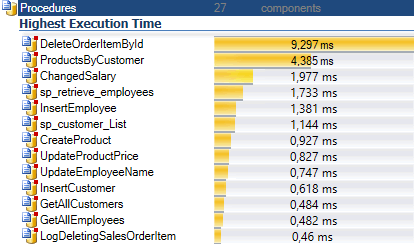
Find slow pieces of code. Remove Bottlenecks
- Find the slowest procedures, functions, triggers
- Reduce the time to access a given table
- Break down the execution time of a large object into sub-queries or instructions.
- Decompose the performance of a chain of calls
Code Comparison
Compare 2 versions of your DB or application:
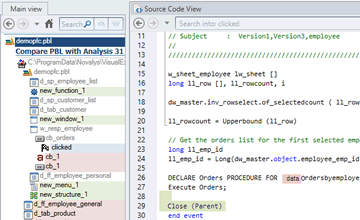
- View differences in a container hierarchy.
- Drill down to find relevant changes.
- Filter changes for a given object, or object type: Userobject, Table, Procedure...
- Filter changes in a given PBL.
- Save “snapshots” of your code on a regular basis, and compare them anytime.
- And more...
Understand Complex Code
Explore the application structure. Understand its inner working.
When maintaining complex Applications, you may need to learn more about the code.
In such cases, Visual Expert is the perfect companion for PowerBuilder.
Navigate in your code via hyperlinks: each reference comes with a link to the referenced item.
Tooltips provide useful information about objects, methods and variables.
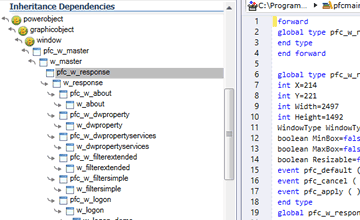
Explore inheritance dependencies between PB objects.
Lots of advanced feature will screen your code under various angles.
Advanced String Search
Visual Expert Global Search addresses common shortcomings:
String searches often return lots of results. They are usually tedious and unproductive.
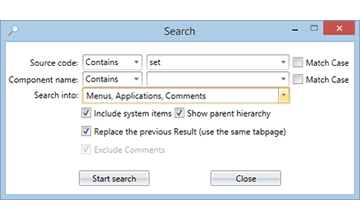
- Use multiple criteria to reduce the search result.
- Restrict search to one or several object types.
- Search for exact words, or words starting/ending with, matching regular expressions…
- Search into several PB targets at the same time.
- Review results in a container hierarchy.
- The strings found are highlighted in the code.
- Filter relevant result items.
- Share the outcome with colleagues.
How it works?
Visual Expert Pricing & Editions
-
-
Basic
up to 500 000 Lines of Code$595 /user
/year- up to 500 000 Lines of Code
- Cross-References / Impact Analysis
- Code Inspection
- Performance Tuning
- Code Documentation
- Installation on a Client PC
- Updates
-
Basic
up to 500 000 Lines of Code$1,395/user
- up to 500 000 Lines of Code
- Cross-References / Impact Analysis
- Code Inspection
- Performance Tuning
- Code Documentation
- Installation on a Client PC
- Mandatory for the 1st year
- Updates - $279
-
-
-
Professional
up to 5 Million Lines of Code$1,195 /user
/year- All Basic Features, plus:
- Up to 5 million Lines of Code
- Analysis History
- Code Comparison
- Analysis Scheduler
- Collaborative Features
- Integration with DevOps Platforms
- Installation on a Client PC or a Server
- Updates
- Mandatory for the 1st year
- Premium Support - $1795
-
Professional
up to 5 Million Lines of Code$2,850 /user
- All Basic Features, plus:
- Up to 5 million Lines of Code
- Analysis History
- Code Comparison
- Analysis Scheduler
- Collaborative Features
- Integration with DevOps Platforms
- Installation on a Client PC or a Server
- Mandatory for the 1st year
- Updates - $570
- Premium Support - $1795
-
-
-
Enterprise
more than 5 Million Lines of Code- All Professional Features, plus:
- More than 5 million Lines of Code
- Volume Discount
- Updates
- Premium Support
-
Enterprise
more than 5 Million Lines of Code- All Professional Features, plus:
- More than 5 million Lines of Code
- Volume Discount
- Updates
- Premium Support
-
Feedback from our clients


